PART II: NOW
THE METHANE CATASTROPHE THAT MAY AWAIT
US TOMORROW
What happened at the end of the Permian is long, long ago, but
not far, far away. The catastrophic release of methane from the
seafloor is not just something which was long ago. It could --
unless we change our way of dealing with our planet, and change
it fast -- happen again tomorrow.
For most people, global warming -- the
gradual and almost imperceptible increase in the world's average
temperature -- is something that is only a dim and distant threat
far in the future...if even then. The amount of global warming
that most of us are likely to experience in our lifetimes is on
the order of a degree or so. Celsius or Fahrenheit (it happens
to be Celsius, in which scale each degree is 1.8 times that of
a Fahrenheit degree): it hardly matters. Such small temperatures
changes make no difference in the lives of most people. After
all, the variability of temperature over the course of a day --
which from where I write is about 17°C (30°F) -- usually
means nothing to us, and whether this spring happens to be a bit
warmer or cooler than last year is typically quite unnoticeable.
Moreover, in the affluent parts of the globe, it is easy to compensate
for such minor temperature differences: with more or less clothing,
with a bit more heat during a cold winter or a bit more air conditioning
during a hot summer. Just change the setting on the thermostat.
The fact that sea level is rising (though
not by much: during the 21st century sea level is expected to
rise less than 40 centimeters/16 inches, about 3/4 due to the
thermal expansion of water, and the rest due to glacier and icecap
melting: Raper and Braithwaite, 2006; though a new report suggests
that a rise of between 50 and 140 centimeters -- 20 to 56 inches
-- may be more probable: Rahmstorf, 2007), and that some areas
of the world will eventually be flooded, is known to the better-read
members of the population. But even for them, warming-induced
sea level changes seem remote. Yes, parts of New York City will
be flooded in a few centuries, along with parts of many other
coastal cities, but none living today will be around to witness
such flooding. Parts of Bangladesh will go under water, and some
island nations may disappear beneath the waves, but, again, these
events will occur in a distant future, to other people, in faraway
lands.
In addition to the indifference caused
by our ability to control our immediate environments, many people
have been apathetic about global warming because they have been
told that there is considerable disagreement among scientists
regarding whether there actually is warming, and, if so, exactly
how much is caused by -- and therefore can be controlled by --
human activities. Unfortunately, these people have been misled,
and, in most cases, deliberately misled. There are always disagreements
among scientists, especially those who are conscientious in their
endeavors. That is simply the way that science works. Disagreement
helps determine truth, because it is disagreement that drives
scientists to look for the evidence that will decide the issue.
Nature -- the "real world" -- is always the decision
maker.
Regarding global warming -- based on
the evidence -- the vast majority of climate scientists are in
agreement about three things:
(1) global warming is real, and will continue to increase,
(2) most global warming is due to human activity, specifically
the burning of carbon fuels, particularly fossil fuels (carbon
fuels include wood, peat, and charcoal in addition to the fossil
fuels: oil, natural gas, and coal), and
(3) as global warming continues, it will have increasingly adverse
effects on human beings, our environment, our fellow creatures,
and the global economy.
It does not seem worthwhile to review
all the enormous amount of evidence for global warming here. There
are many fine books and a constant stream of scientific papers
on the subject. Some of these papers occasionally attract enough
attention that their findings make the daily newspapers. A few
points, however, should be made.
First, the relation between atmospheric
levels of the greenhouse gas carbon dioxide and global temperatures
is clear. During the Phanerozoic (the last 543 million years),
when atmospheric carbon dioxide levels have been high, global
temperatures have been high; when low, global temperatures have
been low. The only exception to this correlation was in the Late
Ordovician (about 440 million years ago), when there was an ice
age despite apparently high levels of carbon dioxide. Other suspected
exceptions seem to have been based on the erroneous presumption
that certain fossils that help provide ancient temperature information
were not altered by conditions during and after their burial,
when, in fact, they were (Pearson, 2001; Schwarzchild, 2001).
The Ordovician exception has attracted further investigation.
But in the 440 million years since that time, there are no other
exceptions (for a review of their own evidence and that of others,
see Royer, 2004). High levels of atmospheric carbon dioxide increase
global temperatures (see Berner and Kothavala, 2001, diagram in
previous section) because carbon dioxide absorbs reflected infrared
radiation, and thus helps the Earth retain heat.
Second, the current warming is not, as
has been alleged, just part of the natural variation. The current
warming, rather, is quite exceptional. And third, it is due to
human activity. Scientists, who generally are by training (if
not by temperament as well) extremely cautious about reaching
conclusions, especially in controversial matters, used to be very
careful about attributing global warming to human activities.
With mounting evidence, that caution has dissipated. In the past
few years, the tone of scientific papers about climate change
has shifted. Now scientists refer to anthropogenic (human-caused)
global warming as a matter of course, and many seem quite (and
properly) concerned that their repeated warnings and calls for
remedial action are not being taken seriously enough.
A single graph provides a compelling
answer to those who still disbelieve the connection between human
activity atmospheric carbon dioxide and global temperatures. It
traces the amount of carbon dioxide in the atmosphere over a period
of 350,000 years, based on samples of ancient air bubbles caught
in the ice at the Vostok Station in Antarctica, the most physically
remote place on the surface of the planet. There, as snow slowly
accumulated over the ages (Antarctica is technically a desert,
because it receives very little precipitation), the snow also
trapped tiny bubbles of air. From ice cores obtained by drilling
through the Antarctic ice, scientists carefully extract that air,
and measure the percentage of carbon dioxide, and the isotopes
of oxygen. The oxygen isotopes can help reveal the temperatures
of long ago. Thus, from the same tiny bubble, scientists can know
both the amount of carbon dioxide in the air, as well as the temperature.
 |
|
Atmospheric carbon dioxide levels
and global temperatures over the past 350,000 years. (kyr BP means thousands of years before present.)
The scale at the left refers to the green line, and indicates
the level of carbon dioxide in the atmosphere. Note that it varies
from about 200 to 300 parts per million by volume (ppmv).
Temperatures are indicated by the blue
scale at the right, which refers to the blue line. Temperature
variation over the past 350,000 years is about 11°C. (Temperature
here is measured by the Kelvin scale, in which each degree is
exactly the equivalent of a degree Celsius, or C. Each degree
Celsius equals 1.8 degrees Fahrenheit.)
Notice how temperature closely varies
with carbon dioxide level -- except at the extreme right. Here,
for emphasis, the green line for carbon dioxide has been changed
to red, to indicate the dramatic increase in atmospheric carbon
dioxide -- in just two centuries. That red line, incidentally,
has reached 380 ppmv as of mid-2005. (Rahmstorf, 2004)
|
The graph shows atmospheric carbon dioxide
(CO¸2) and global temperature rise and fall in lock-step
for these hundreds of thousands of years, right up until the present
(the last hundred and fifty years or so). Then, a vertical red
line, marked "anthropogenic CO¸2," abruptly --
and to those concerned about global warming, alarmingly -- spikes
upward. The blue line designating temperature as yet records no
change in response to this surge in atmospheric carbon dioxide
(Rahmstorf, 2004, figure 1), but it will.
(According to newer Antarctic ice core
studies, the same pattern holds back as far as 650,000 years.
Though the level of atmospheric carbon dioxide reached about 300
ppmv twice at times other than the present during that 650,000
year period, it certainly never exceeded that level until the
present, and is now at 380 ppmv: Siegenthaler, 2005; Brook, 2005.)
Though the red "anthropogenic CO¸2"
line spikes straight up, this reflects the fact that the graph
covers a period of more than a third of a million years; hence,
the graph compresses all detail into a vertical direction. This
is useful for comparing the rise and fall of carbon dioxide and
global temperature over long expanses of time, and in putting
the current spike in carbon dioxide in its proper long-term perspective,
but it does not provide insight into the annual changes in carbon
dioxide. A different graph, showing the increase in atmospheric
carbon dioxide over the past several decades, furnishes those
details.
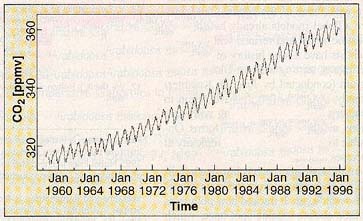 Recent increases in atmospheric
carbon dioxide. (Crutzen and
Ramanathan, 2000)
Recent increases in atmospheric
carbon dioxide. (Crutzen and
Ramanathan, 2000)
Four things should be noted about this
graph. First, it only records the changes in atmospheric carbon
dioxide over the past few decades. Anthropogenic global warming
has been happening at least since the beginning of the industrial
age, about 200 years ago, but scientists only have precise information
from about the past 40 years. Thus, while the graph begins at
less than 320 ppmv (parts per million by volume), the actual pre-industrial
average of atmospheric carbon dioxide is 220 ppmv, as averaged
over 420,000 years (Falkowski, 2000). (The immediate pre-industrial
level of carbon dioxide, from about 200 years ago, may have been
about 280 ppmv. This value is commonly employed in climate assessments.
Over the past 1000 years, this value has remained almost constant,
with a variation of no more than 10 ppmv.) This means that the
graph omits a major part of the anthropogenic carbon dioxide increase
over the past 200 years, but simply because we were not engaged
in the precision monitoring of carbon dioxide prior to about 40
years ago. As noted previously, atmospheric carbon dioxide has
now reached 380 ppmv.
|
Measuring Carbon
Dioxide
The amount of carbon dioxide in the atmosphere can be stated
in a number of different ways. The most common way is by indicating
the quantity of CO¸2 in ppmv (parts per million per volume).
The current (as of June, 2005) amount of CO¸2 is over 380
ppmv, meaning that if we took the entire atmosphere and divided
it into a million equal parts, CO¸2 would constitute 380
of those parts. This quantity could also have been expressed
as a percentage: 0.038%, but that is such a tiny percentage that
it seems insignificant. Working with such tiny percentages also
tends to cause errors, as when decimal points are misplaced,
so the ppmv value is used instead.
Sometimes scientists
employ weight in place of volume. In such cases, the designation
ppmw is used, indicating parts per million by weight. Weight
and volume measures are not identical (think of a cup of air
versus a cup of lead), so scientists need to specify which measuring
system they are using.
Another system is that
employed for carbon isotopes, as mentioned previously. This system
uses per mil, meaning parts per thousand. By using per mil rather
than percent (%, that is, parts per hundred), a typical negative
carbon isotope shift becomes 3 per mil, rather than 0.3%.
The per mil value is less likely to cause errors, and is easier
to understand and work with.
|
Second, the measurements for the graph
were taken at the Mauna Loa Observatory on Hawaii (by the recently
deceased Charles Keeling, who figured out how to measure atmospheric
carbon dioxide and is one of the discoverers of global warming).
The Observatory is at the summit of the volcanic peak, which rises
almost 3500 meters (more than two miles) above sea level. Mauna
Loa is an excellent place from which to monitor atmospheric concentrations
of carbon dioxide, as it is far from the most significant sources
of that gas; indeed, it is probably one of the best places in
the northern hemisphere from which to conduct such measurements.
(In fact, increased atmospheric carbon dioxide and global warming
were first detected there.) Third, the sawtooth pattern simply
reflects small seasonal variations in the general trend, and so
are unimportant. Fourth -- and quite important -- is that the
general trend of the line curves slightly upward with time (look
at the line from its lower left corner). This means that the problem
is getting worse from year to year, not getting better or merely
staying the same.
(The increase in the level of atmospheric
carbon dioxide may in part be accelerating due to global warming
itself. In the summer of 2003, Europe experienced one of the greatest
heat waves ever. Temperatures soared some 6°C [10.8°F]
above the average recorded since 1851, and rainfall was down 50%
from its long-term average [Baldocchi, 2005]. This caused a drop
in primary productivity -- plant growth -- of some 30%, and a
major increase in the release of carbon dioxide in the affected
region [Ciais, 2005].)
An additional graph looks at the relation
between atmospheric carbon dioxide and temperature for all ice-core
air samples from which we have data on both. (The data used in
this graph also comes from the ice cores of the Vostok station.)
 |
| Relation between carbon
dioxide and global warming or cooling over the past 350,000 years. Each data point (from the Vostok, Antarctica,
ice cores) shows both a carbon dioxide measurement and one for
temperature (using oxygen isotope levels). The data points have
been divided into two groups, depending on whether the data was
taken from a time when glaciation was increasing (black points)
or decreasing (gray points). During cooling periods (glaciations),
both temperature and carbon dioxide drop; during warming periods
(deglaciations), both temperature and carbon dioxide rise. The
arrows indicate the general trends. (Falkowski, 2002) |
Each point on this graph displays the
information provided from one air sample, and each is color-coded
according to whether it came from a period of glaciation (black)
or deglaciation (gray) during the most recent part of the Ice
Age. Unlike the previous graph, which traces carbon dioxide and
temperature over time, this graph plots the level of carbon dioxide
against temperature, displaying how they have varied in relation
to one another. The arrows show what has happened: the Glaciations
arrow indicates that the fall of atmospheric carbon dioxide correlates
with the fall of global temperature. During Deglaciations, it
is the opposite: the rise of carbon dioxide is correlated with
the rise of global temperature.
There is a curious and particularly disturbing
aspect to this graph. That is the direction of the arrow labeled
"Modern." Although the arrows labeled Glaciation and
Deglaciation point in opposite directions, they still define the
same linear orientation, rather as a highway defines a particular
route, even though it goes in two different directions. (Like
the hands of a clock -- taking the top of the page as the 12 o'clock
direction -- they point in about the 2 o'clock and 8 o'clock directions.)
But the "Modern" arrow veers off on its own (in about
the 12:30 direction). It does so because carbon dioxide is rapidly
accumulating in the atmosphere.
Global temperatures, however, have not
caught up. They will, and the angle at which the "Modern"
arrow veers off will most likely, but gradually, come to define
the same trend as do the Glaciations and Deglaciations arrows.
(In other words, the arrow, like the hand of a clock, will slowly
rotate clockwise from its current 12:30 position towards 2 o'clock
as global temperatures increase.) Unfortunately, unless we severely
curb emissions from the burning of fossil fuels, that arrow will
reach to over 560 ppmv of carbon dioxide (double the pre-industrial
level) in the atmosphere before the end of this century.
Extended to 560 ppmv in the direction
currently indicated, the arrow projects global temperatures may
reach about 6.5°C higher than at present. That projection
is equivalent to some of the higher estimates of the amount the
planet will warm by the year 2100, so it does not seem unreasonable,
though many climate scientists believe that warming is likely
to be less. However, if the direction of the "Modern"
arrow does with time indeed slowly rotate clockwise, the planet
will be warmer, perhaps considerably warmer, than those estimates
now forecast.
Ocean acidification
In addition to warming the planet, increasing
atmospheric carbon dioxide will have a further major planetary
effect. Much of the fossil fuel carbon dioxide will enter the
ocean from the atmosphere. There it will acidify the ocean. Excess
carbon dioxide is now entering the ocean, from the atmosphere,
at the appalling rate of about a million metric tons per hour,
leading to decrease in ocean surface pH, that is, to an increase
in acidity, of about 0.1 pH (Cicerone, 2004). A negative 0.1 pH
change may not seem like much, but it represents a 30% increase
in acidity. By the end of this century, pH will have dropped by
another 0.2 to 0.4, possibly increasing acidity by more than 150%.
(Negative pH changes represent exponential [geometric] increases
in acidity rather than linear increases.) Organisms with calcium
carbonate skeletons will be hard pressed to survive.
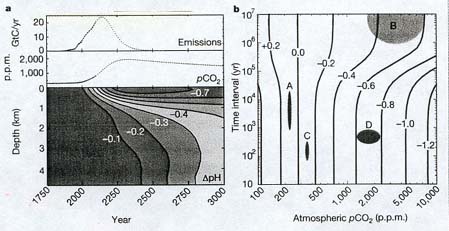 The future acidification of
the ocean due to the influx of carbon dioxide. Diagram a is composed of three parts. The topmost part
indicates the amount of carbon dioxide which will be emitted by
the continued burning of fossil fuels over the next few hundred
years (time scale is on bottom of diagram). Emissions peak about
2150, and thereafter decline as fossil fuels are used up. Atmospheric
carbon dioxide (pCO¸2), however, increases until
it reaches a maximum about year 2250, and then declines very slowly
(the middle part of Diagram a). The bottom part of the diagram
shows the changes in ocean acidity over the next thousand years,
according to ocean depth. Note that it is the surface ocean which
is most affected: the negative figures refer to the change in
pH, the measure of acidity. The more negative the number, the
greater the increase in acidity. Diagram
b helps put this coming acidification in perspective, by indicating
the change in ocean acidity over various time scales, from 10
years to 10 million (10^7) years. The blob labeled A shows the
range of ocean acidification during the Ice Age: it was actually
slightly more alkaline (less than 0.0) than today, and its variations
took place over periods from 1000 (10^3) to 10,000 (10^4) years.
Blob B shows the range of ocean acidity over the past 300 million
years: acidity varied by up to 0.6 pH units, but over a very
long period of time. Blob C indicates the minor acid changes over
historical time, in the past century or so. Blob D shows what
will happen to ocean acidity over the next centuries, assuming
we do not change our current pattern of fossil fuel consumption:
greater acidification (0.6 to 0.8 pH units) over a vastly
shorter period of time than occurred over the 300 million years
indicated by blob B. The basic message of Diagram b: our continuing
burning of fossil fuels will acidify the ocean more -- in just
a few centuries -- than it was acidified during the past third
of a billion years. Human activities will therefore cause the
demise of creatures with calcium carbonate or calcium phosphate
skeletons (corals, mollusks, coccoliths, fish, and lots of other
organisms), which will be unable to cope with the rapidly acidifying
conditions. (Caldeira and Wickett, 2003)
The future acidification of
the ocean due to the influx of carbon dioxide. Diagram a is composed of three parts. The topmost part
indicates the amount of carbon dioxide which will be emitted by
the continued burning of fossil fuels over the next few hundred
years (time scale is on bottom of diagram). Emissions peak about
2150, and thereafter decline as fossil fuels are used up. Atmospheric
carbon dioxide (pCO¸2), however, increases until
it reaches a maximum about year 2250, and then declines very slowly
(the middle part of Diagram a). The bottom part of the diagram
shows the changes in ocean acidity over the next thousand years,
according to ocean depth. Note that it is the surface ocean which
is most affected: the negative figures refer to the change in
pH, the measure of acidity. The more negative the number, the
greater the increase in acidity. Diagram
b helps put this coming acidification in perspective, by indicating
the change in ocean acidity over various time scales, from 10
years to 10 million (10^7) years. The blob labeled A shows the
range of ocean acidification during the Ice Age: it was actually
slightly more alkaline (less than 0.0) than today, and its variations
took place over periods from 1000 (10^3) to 10,000 (10^4) years.
Blob B shows the range of ocean acidity over the past 300 million
years: acidity varied by up to 0.6 pH units, but over a very
long period of time. Blob C indicates the minor acid changes over
historical time, in the past century or so. Blob D shows what
will happen to ocean acidity over the next centuries, assuming
we do not change our current pattern of fossil fuel consumption:
greater acidification (0.6 to 0.8 pH units) over a vastly
shorter period of time than occurred over the 300 million years
indicated by blob B. The basic message of Diagram b: our continuing
burning of fossil fuels will acidify the ocean more -- in just
a few centuries -- than it was acidified during the past third
of a billion years. Human activities will therefore cause the
demise of creatures with calcium carbonate or calcium phosphate
skeletons (corals, mollusks, coccoliths, fish, and lots of other
organisms), which will be unable to cope with the rapidly acidifying
conditions. (Caldeira and Wickett, 2003)
A detailed examination (Orr, 2005) of
the likely effects of ocean acidification notes that not only
will the world ocean become more acidic, but that the level of
carbonate ions (CO¸3^2) will also fall. Both of these
effects -- the increase in acidity and the decrease in carbonate
ions -- will be bad news for marine organisms with calcium carbonate
skeletons, many of which provide shelter and/or food for organisms
higher on the food chain, including human beings. Corals, for
example, offer shelter for numerous invertebrates and fish, and
are sometimes consumed by them. Pteropods, which are mollusks,
and therefore the distant relatives of oysters, clams, octopi,
and squids, are generally small, thin-shelled creatures that furnish
food for many fish, such as salmon, mackerel, herring, and cod.
They also are food for baleen whales (which strain water for food
particles). In polar waters, pteropods may be almost as important
as krill (shrimp-like crustaceans) in the diets of higher marine
organisms (Orr, 2005).
Both corals and pteropods, however, construct
their skeletons from aragonite, a less stable crystalline form
of calcium carbonate (CaCO¸3). This particular mineral is
more vulnerable to dissolution by acid than is calcite, the more
stable crystalline form. As the world ocean acidifies, coral and
pteropod skeletons will begin to dissolve, and growing corals
and pteropods will find it increasingly difficult to construct
their skeletons. This ecological threat will first appear in the
world's coldest waters, because cold water can hold more dissolved
carbon dioxide (just like cold soda, remember?)(Orr, 2005).
Two different scenarios for the coming
increase in atmospheric carbon dioxide suggest that the survival
prospects for cold water corals and pteropods in the 21st century
is not good. According to one "business-as-usual" scenario
(the IPCC's IS92a scenario) which postulates that human dumping
of carbon dioxide will continuously increase, atmospheric carbon
dioxide will rise to about 788 ppmv by the year 2100. The point
of doubling beyond pre-industrial carbon dioxide levels (560 ppmv),
therefore, will be reached around 2050. At this level of atmospheric
carbon dioxide, the Southern Ocean's surface waters will be "undersaturated"
with regard to dissolved aragonite. That means there will not
be enough aragonite available in surface waters for those organisms
which depend on it (Orr, 2005).
Organisms which construct their skeletons
from carbonate minerals other than aragonite will also suffer.
Coralline red algae and echinoderms (sea urchins, starfish), which
make their skeletons from calcite that contains magnesium, will
be affected even before corals and pteropods, because this form
of calcite is even more vulnerable to dissolution than aragonite.
Organisms which use relatively pure calcite, such as foraminifera
and coccolithophores, will fare better, but not for long: calcite
undersaturation will follow that of aragonite undersaturation
by 50 to 100 years (Orr, 2005). The dissolution of coccolithophore
skeletons (which do contain some magnesium) will cause not only
the demise of the coccolithophores, but what could be the beginning
of a significant drop in the level of atmospheric oxygen. Coccoliths
(the shorter version of the name) are photosynthetic organisms
which contribute a substantial amount of oxygen to the air.
Thus, by 2100, the situation will be
far worse: pH will have dropped by another 0.3 to 0.4 units (relative
to today's oceanic pH), representing a 100 to 150% increase in
ocean acidity. At that point, the entire Southern Ocean (not just
the surface waters), will be undersaturated with regard to aragonite.
The sub-polar Pacific Ocean will be similarly affected (Orr, 2005).
A second scenario (the IPCC's "stabilization"
scenario, S650) projects that acidification will take place more
slowly. It assumes that atmospheric carbon dioxide will rise less
rapidly, and level off at about 560 ppmv (twice pre-industrial)
at about 2100. Under this scenario, the same conditions will be
reached about 50 years later than with the "business-as-usual"
scenario (Orr, 2005).
Previous studies had indicated that the
process of increasing oceanic acidification would take centuries,
but these researchers find serious acidification will take only
decades (Orr, 2005). Disastrous as this probability is, however,
it just glimpses our near-future prospects, to about the end of
the twenty-first century. As the Caldeira and Wickett diagram
(above) indicates, acidification of the ocean will not arbitrarily
stop at the end of the present century, but will continue for
many centuries more. And all of these scenarios focus on carbon
dioxide, without attempting to include the possibly greater threat:
seafloor methane.
METHANE RELEASE; METHANE CATASTROPHE
With the warming of the planet will come
the release of hydrate methane. Already, the West Siberian Peat
Bog, containing perhaps a quarter of the world's inventory of
methane hydrate that is locked into continental permafrost, has
begun to melt and is releasing some of that store of methane.
The slight warming the Bering Sea and the northern coastal region
of Alaska has undergone presumably has started to free some of
its own hydrate methane. The current slow release, however, will
certainly accelerate as increased temperatures heat high latitude
continental regions, and warm ocean currents, disturbing marine
circulation patterns.
Even if hydrate methane release never
reaches a stage that can fully be described as catastrophic, it
could make the difference between quite serious and quite deadly
global warming. As time goes by, we can expect that methane will
make more and more of a contribution to what may become not mere
global warming but global scorching. But at some unpredictable
"tipping point," the accelerating release may become
overwhelming.
One way that such an accelerated release
could occur is via a major submarine landslide, which can happen
in a matter of hours, and which could trigger additional slumping
and further sudden methane release. The stability of the continental
margins in which methane hydrates reside is unclear: "It
is not known if future warming is sufficient to cause failure
of continental slopes on a global scale, but isotopic evidence
of rapid carbon release in the past is suggestive" (Buffett
and Archer, 2004).
Another release mechanism is by the venting
of vast quantities of free methane and dissociated hydrate methane
over a period of decades, perhaps triggered by marine warming
sufficient to allow the fracturing of seafloor sediments by the
free methane gas that underlies the hydrate. Either mechanism
has the potential to abruptly and massively release continental
margin methane within a short period of time, say, within a hundred
years, or a few centuries at most. These are events that can take
place in what is essentially a geological eyeblink, and will be
beyond our ability to prevent (except by ceasing to dump carbon
dioxide into the atmosphere), remedy, or mitigate.
At some point, that is, the release of
methane may indeed become catastrophic, with a surge of this powerful
greenhouse gas that could make the mere carbon dioxide warming
of the planet pale to insignificance. Although some scientists
(Harvey and Huang, 1995, for instance) believe that a powerful
release of methane may await us, but probably no sooner than thousands
of years in the future (if then), when ocean warming finally penetrates
to what was at the time (1995) thought to be standard hydrate
depth. Nonetheless, they recognized that such projections could
be in error if more rapid release mechanisms prevailed.
University of Chicago geophysicists David
Archer and Bruce Buffett, who also study what will happen with
the immense store of hydrate methane in the seafloor, have estimated
that some 85% of that inventory will be released with a 3°C
(5.4°F) warming. Their calculations indicate that there are
about 3000 billion metric tons (Gt) of hydrate and some 2000 billion
metric tons (Gt) of "bubbles" -- the free gas that underlies
the hydrate -- in the seafloor worldwide (Buffett and Archer,
2004).
Though this about half of the usual estimate
of 10,000 billion metric tons (Gt) for seafloor methane, Archer
notes that the oxygenation level of the ocean bottom is a significant
factor in determining how much methane may be contained within
the seafloor. If the deepest water of the Arctic Ocean is anoxic
--as it could be, because of its restricted circulation -- the
methane hydrate inventory would be greater (Archer, 2006). In
addition, the Buffett and Archer calculations of the quantity
of seafloor methane rely on measurements of carbon rain, the organic
matter dropping through the water column to the ocean floor. The
discovery of giant larvaceans, with their ability to send packages
of organic matter rapidly to the ocean floor, has, according to
the discoverers, been overlooked in previous estimates of carbon
rain, and led to underestimates of 50 to 100% (Robison, 2005).
While Buffett and Archer project a loss
of 85% of seafloor methane with a warming of 3°C, a more conservative
estimate finds that about 2000 billion metric tons (Gt) of methane
could be released with a seafloor temperature increase of 5°C
(9°F) (Hornbach, 2004). (That is one-fifth of the usual estimate
of 10,000 Gt of methane hydrate in the world's continental margins.)
That's more than 2 1/2 times the amount of carbon as in the atmosphere.
(Buffett and Archer's estimated release of 85% of their calculated
quantity of seafloor methane amounts to 4 1/4 the amount of carbon
in the atmosphere, or 8 1/2 times that carbon if seafloor methane
is 10,000 Gt.) The carbon in the atmosphere, moreover, is largely
in the form of carbon dioxide, which is a far less powerful greenhouse
gas than methane. Though this methane would quickly be oxidized
-- to carbon dioxide -- once it reached the atmosphere, even its
short-term presence would deliver a stunning jolt of heat to the
planet. The derivative carbon dioxide will maintain that heat
over a much longer term.
At the end of the Permian, carbon dioxide
was initially injected into the atmosphere by the Traps eruptions.
These eruptions were presumably episodic, spread out over hundreds
of thousands of years, interspersed with long periods of dormancy.
Nonetheless, at least one or more of these episodes was sufficient
to release vast quantities of seafloor methane. As noted previously,
the primary trigger for seafloor methane release was presumably
the direct heating of the PaleoArctic continental margin by Siberian
Traps volcanism, particularly by the emplacement of magmatic sills
within the seafloor sediments. No doubt, however, volcanic carbon
dioxide also played a role in warming the planet and releasing
hydrate methane.
But while not as dramatic, our own releases
of carbon dioxide from the burning of fossil fuels well exceed,
on average, those of the Siberian Traps. While not episodic, nor
as sudden, our releases are considerable, continuous, and increasing.
In no more than 300 years, virtually all of the accessible fossil
fuel carbon reservoir -- some 5000 billion metric tons (Gt) --
will have been transferred to the atmosphere, in the form of carbon
dioxide, if we continue to burn up our fossil fuels.
To put this carbon dioxide release into
perspective, it is roughly equivalent to the total amount of carbon
dioxide injected into the atmosphere by the Siberian Traps volcanism.
Estimating from several sources, total Siberian Traps CO¸2
may have been about 1/2 to 2 1/2 to 4 times the amount of CO¸2
that will be released from the burning of fossil fuels (estimates
based on Leavitt, 1982 and Gerlach and Graeber, 1985, as cited
by Beerling and Berner, 2002, and Javoy and Michaud, 1989, as
cited by Grard, 2005). Moreover, this colossal quantity of carbon
dioxide will not be released over some 900,000 ± 800,000
years, as it was at the end of the Permian (Renne and Basu, 1991),
but in the course of just three centuries. That amounts to an
anthropogenic rate of carbon dioxide release that is roughly tens
to perhaps thousands of times faster than the average rate of
the end-Permian.
|
The numbers:
Stating that the "anthropogenic
rate of carbon dioxide release , , , is roughly tens to perhaps
thousands of times faster than the average rate at the end of
the Permian" may seem to be an extraordinary claim, so here
are the numbers. The amount of fossil fuel carbon is about 5000
billion metric tons (Gt), equivalent to some 18.3 trillion metric
tons (Tt) of carbon dioxide. Released into the atmosphere over
the next 300 years, that is an average of about 61 billion metric
tons (Gt) of anthropogenic carbon dioxide per year.
The maximum estimated
volume of Siberian Traps extrusives is about 3 million cubic
kilometers (about 720,000 cubic miles). Divided by an estimated
length of Siberian Traps volcanism of some one million years,
the average volcanic extrusion rate is 3 cubic kilometers (about
0.72 cubic miles) per year. Leavitt, 1982, estimates that each
cubic kilometer of extruded basalt releases 3.5 million metric
tons (Mt) of carbon dioxide, for a total of 10.5 million metric
tons (Mt) of carbon dioxide as the average annual release rate
for Siberian Traps volcanism. Comparable total figures from Gerlach
and Graeber, 1985, and Javoy and Michaud, 1989, are 48 million
metric tons (Mt) per year, and 70.4 million metric tons (Mt)
per year, respectively.
The anthropogenic carbon
dioxide release rate is therefore about 6000 times faster than
the average Siberian Traps release rate indicated by Leavitt,
1250 times faster than that of Gerlach and Graeber, and 850 times
faster than that of Javoy and Michaud. If the duration of Siberian
Traps volcanism much shorter than a million years, as say on
the order of 100,000 years (the shortest duration estimated by
Renne and Basu, 1991), relative rates would be reduced by an
order of magnitude, to 600 times faster than the Leavitt estimate,
125 times faster than the Gerlach and Graeber estimate, and 85
times faster than the Javoy and Michaud estimate.
In examining these figures,
however, it is important to note that the Siberian Traps carbon
dioxide release rates are averages, and that large igneous province
volcanic eruptions are presumably highly episodic. Consequently,
actual carbon dioxide release rates are probably quite variable
over the course of the eruption's duration.
|
This enormous release of carbon dioxide
ought to be quite sufficient to warm air and ocean enough to liberate
a vast quantity of methane from its icy seafloor muds.
A massive methane release, and perhaps
a true methane catastrophe, is just around the corner, geologically
speaking -- as well as in human terms. Assuming we continue to
conduct business as usual, it is inevitable. When it will happen
cannot be predicted, but it will likely begin between about a
hundred and, at most, a thousand years from now. Once it starts
-- or even well before it starts -- it will be irreversible. Each
of these characteristics -- inevitability, magnitude, unpredictability,
and irreversibility -- requires further elaboration.
Inevitability
The release of seafloor methane is inevitable because we are pumping
unprecedented quantities of carbon dioxide into the atmosphere.
This carbon dioxide will warm the planet, and, in fact, is already
doing so. Though the amount of global warming thus far (that is,
in the twentieth century) is minimal -- only about 0.6°C (about
1°F), plus or minus 0.2°C -- the warming will significantly
increase during this, the twenty-first century. The most generally
accepted projections for global warming, those from the Third
Assessment Report of the UN-sponsored Intergovernmental Panel
on Climate Change (IPCC), indicates that the world's surface will
warm by about between 1.4°C and 5.8°C (2.5°F to 10.4°F)
by the end of this century (Kerr, 2001). As of the IPCC's 2007
Fourth Assessment Report, likely warming is projected at 1.1°C
and 6.4°C (2.0°F to 11.5°F), with warming very likely
between 1.8°C and 4.0°C (3.2°F to 7.2°F: IPCC
2007). Though this warming estimate represents the consensus thinking
of the approximately 2500 climate scientists worldwide, recent
warming estimates indicate that it may be too conservative.
Typically, climate scientists make their
projections of global warming by estimating the heating effect
of a doubling of atmospheric carbon dioxide, which has been expected
to occur by the end of the twenty-first century. (The amount of
warming that will take place as a result of a doubling of atmospheric
carbon dioxide is often referred to as "climate sensitivity,"
though this is not the precise meaning of the term: see Schlesinger
and Andronova, 2002.) Using a different and complex approach,
some scientists now believe that there could actually be somewhat
less warming than projected by the IPCC.
But these same scientists believe that
there is an even greater likelihood -- in fact, a much greater
likelihood -- that warming could considerably exceed the IPCC's
projection. According to their projections, warming by the end
of the century will likely range between 1.0°C and 9.3°C
(1.8°F to 16.7°F), with the upper estimate significantly
higher than that of the IPCC. The scientists who reached these
conclusions find them -- in a modest departure from the ordinarily
unemotional language of science -- "a disquieting result"
(Andronova and Schlesinger, 2001).
In January 2005, this disquieting result
was confirmed as a real possibility by the largest computer climate
simulation ever done. Employing computer time from almost 100,000
home computers, the study compiled the results from the climateprediction.net
experiment. (The
harnessing of huge amounts of home computer time has become a
standard activity in certain branches of science which require
such time for extremely complex calculations. Ordinary citizens
can make important contributions to science by the donation of
such unused home computer time. This endeavor is immensely valuable
for climate scientists, and readers are strongly encouraged to
assist. This project does not interfere with the ordinary use
of home computers. Details are furnished at the website, www.climateprediction.net)
With a doubling of atmospheric carbon
dioxide, the study found, the possible global warming (that is,
the "climate sensitivity") could range from 1.9°C
(3.4°F) to as much as 11.5°C (20.7°F). Nonetheless,
the study also found that the most likely temperature increase
would be about 3.4°C (6.1°F), just as the IPCC had (Stainforth,
2005). One of the study's co-authors, Robert Spicer, pointed out
that the highest temperatures in "recent" earth history
occurred some 100 million years ago (during the Cretaceous Period),
but that global temperatures at that time were probably only about
6°C (10.8°F) higher than today's (Connor, 2005). If the
highest likely temperatures projected by the climateprediction.net
study were to come to pass, they would be without precedent in
hundreds of millions of years, perhaps for the entire Phanerozoic
(Royer, 2004).
The disquieting findings of Andronova
and Schlesinger were echoed by Richard Alley of Pennsylvania State
University, Chair of the National Research Council's Committee
on Abrupt Climate Change, at the December 2001 meeting of the
American Geophysical Union. Alley, who was discussing his committee's
newly released report "Abrupt Climate Changes: Inevitable
Surprises," stated that significant global warming could
come much more rapidly than the IPCC projects. He warned that
global temperatures could rise 10°C (18°F) in just a short
time, "tripping the switch" towards abrupt climate change
in only a few decades (Showstack, 2001).
Nonetheless, the IPCC's 2007 Fourth Assessment Report pegs climate
sensitivity (here, the doubling of atmospheric carbon dioxide)
at between 2.0°C and 4.5°C (3.6°F to 8.1°F), with
its best estimate being 3.0°C (5.4°F). This is not very
different from another new estimate that puts climate sensitivity
at between 1.5°C and 6.2°C (2.7°F to 11.2°F),
with the most likely figure being 2.8°C (5.0°F). This
estimate is based on a comprehensive study of carbon dioxide levels
and presumed temperatures over the past 420 million years (Royer,
2007). However, because the weathering of silicate rocks draws
down atmospheric carbon dioxide and restores temperatures some
100,000 to 150,000 years after a carbon dioxide outburst, this
study may well overlook short, extreme spikes of temperature.
The warming that the planet has already
experienced is not restricted to the lower atmosphere, or to the
sea surface. Scientists used to be puzzled as to where the heat
was going, because there seemed to be more heat being produced
by global warming than could be accounted for, based on atmospheric
and sea surface measurements. This is a conundrum no longer. As
many scientists had previously suspected, the heat is going into
the oceans. But they were only able to suspect that the oceans
were taking up the heat because they lacked the ability to measure
it. That has changed.
Based on the systematic investigation
of millions of temperature records from various ocean depths worldwide,
it is now clear that the "excess heat" is indeed going
into the oceans. In fact, more than 90% of the heat from global
warming has gone into the ocean, with the remaining heat having
gone into the melting of polar region ice and mountain glaciers,
and the atmosphere (Levitus, 2000). The oceanic temperature increase
(0.06°C, or about 0.1°F) is minute -- only about a tenth
of the temperature rise in the atmosphere -- but it represents
an enormous amount of heat, because of the vast ability of the
ocean to hold heat. The Atlantic, Indian, and Pacific Oceans all
record the increase, and all indicate similar heat variations
with time, over a forty year period from 1955 to 1995. All oceans
show a similar increase trend (Levitus, 2000):
 |
| Ocean warming, 1955-1995. The heat is measured in joules (J), but the
specific units are far less important than the general trends,
obvious in all oceans. The red lines and the red figures indicate
the approximate warming that has taken place, based on millions
of measurements. (Levitus, 2000) |
Perhaps most importantly, the warming
has penetrated to deeper parts of all oceans, at depths from 300
to 1000 meters (about 900 feet to 6/10ths of a mile), and in the
North Atlantic, even below the 1000 meter level. The total temperature
increase of 0.06°C is the average of temperature readings
down to 3000 meters (Levitus, 2000), emphasizing just how deeply
the warming has penetrated. Such a warming of the deep ocean in
such a short time was previously not thought possible. The North
Atlantic data are possibly the most startling, because that ocean
seems to be highly vulnerable to global warming, and most able
to impact climatic conditions on its periphery and worldwide,
because of its major role in driving global thermohaline circulation.
As a result of the warming, the ecology
of the North Atlantic seafloor may be changing. The population
of small (5 centimeters/2 inches long) marine creatures, the sea
cucumbers (holothurians, a large group of echinoderms and thus
the cousins of starfish, sand dollars, and sea urchins) has increased
dramatically. Their numbers have jumped more than a thousand-fold
since just 1996, an increase attributed to an influx of dead algae.
Though the cause of the population surge has yet to be determined,
climate change is a likely suspect (Krieger, 2004). Most likely,
warming sea surface temperatures in the North Atlantic have resulted
in a major die-off of plankton, furnishing the ocean-bottom-dwelling
sea cucumbers with an unexpected -- and unsustainable -- bounty
of food.
|
The meaning of catastrophe
Catastrophe is so frequently
used in ordinary discourse that it has lost most of its meaning.
Though people in the world's poorer countries often have experience
with catastrophic war, famine, infectious disease and floods
(as this is written, half of Dacca, Bangladesh, a city of 10
million, is currently under water from monsoon-related flooding,
as is 60% of this 140 million population country), most of the
populations of affluent countries have no experience with catastrophe.
What passes for catastrophe are often family tragedies, which
loom large for the affected individuals, but generally assume
no wider significance.
But there are real catastrophes
-- sometimes local, sometimes regional, sometimes global -- both
for human beings and the other inhabitants of the planet.
Here is one:
North of Scotland, washed
by the North Sea to the east and the North Atlantic to the west,
lie small archipelagos called the Orkney (about 70 islands) and
the Shetland Islands (about 100 islands). Only a few islands
of these, the Northern Isles, are inhabited, though during the
breeding season the islands' rocky cliffs host huge numbers of
seabirds -- guillemots (members of the auk family), Arctic terns
and Shetland kittiwakes (gull family), great skuas and Arctic
skuas, (skua family) -- birds not familiar to most Americans,
Europeans, Asians. These are subarctic birds, which generally
live far to the north of the most populated areas of the Northern
Hemisphere (though some of their relatives do live in more temperate
regions).
In recent years, according
to Seabird 2000, the bird count released a few months ago, more
than 220,000 pairs of these birds have been breeding in these
Scottish islands. But not this year. In 2004, this huge number
of birds produced virtually no young: at most, a few dozen chicks
in all. The breeding season has been a total, unprecedented failure
(McCarthy, 2004). As Subarctic and Arctic regions warm, the ultimate
survival of these birds may be at risk.
This disaster may be
the first ripple of the wave of climate change-induced extinction
that will engulf the planet. The ultimate cause of the breeding
failure most probably is the warming of the eastern North Atlantic,
which has pushed warm-water phytoplankton some 1000 kilometers
(600 miles) north -- about a 10° latitude shift -- in just
40 years (Beaugrand, 2002), and a temperature increase of about
2°C (3.6°F) in the North Sea over the past 20 (McCarthy,
2004). (Another source indicates the temperature rise was only
1°C over the past 40 years: Martin Edwards, cited by Proffitt,
2004b.) This warming has resulted in the northern movement of
the plankton that used to live in the Shetland/Orkney area, as
cold-water phytoplankton followed the retreating, cooler waters.
This movement deprived copepods, minute crustaceans which live
off the phytoplankton, of their primary food (Beaugrand, 2002).
The high mortality of
the local phytoplankton and copepods has resulted in a massive
die-off of sandeels, and young sandeels in particular. Sandeels
(often written as "sand eels"), as their name implies,
are small (adults from the various species range from about 20
to 35 centimeter/8 to 14 inch in length), elongated, eel-like
fish that prefer sandy seafloor environments, and burrow into
them when threatened. The sandeels are a major food source for
numerous other organisms.
Although at least one
scientist has proposed that the cause of the plummeting number
of sandeels may be an increase in the local population of herrings,
together with the fact that the North Sea is one of the most
overfished ocean areas of the world (Proffitt, 2004a), this seems
rather unlikely. The overfishing has been a persistent though
growing problem; the seabird reproduction failure is abruptly
new. In addition, the population explosion of sea cucumbers,
mentioned previously, confirms that the quantity of organic debris
reaching the seafloor has enormously increased. This debris presumably
consists of the remains of phytoplankton and copepods, whose
skyrocketing mortality is due to oceanic temperature change.
Dead phytoplankton and copepods may serve the dietary needs of
sea cucumbers, but the precipitous population decline of these
minute organisms has left the sandeels without sustinance.
Above the sandeels on
the food chain are larger fish, such as cod, whose numbers are
falling, marine mammals, and the birds, now too malnourished
to reproduce (McCarthy, 2004). The former food chain has been
replaced by a chain of starvation.
In the far north of
Britain, the great chain of being has been sundered.
[Postscript, 7/12/05,
updated 10/31/06: On the Northwest Coast of the United States
(northern California, Oregon, Washington), there has been a severe
decline in the amount of plankton, including copepods and krill,
in the spring and early summer of 2005 (Martin, 2005). Copepods
and krill are crustaceans, and (at up to 2.5 cm -- an inch --
in length) are among the largest of the zooplankton, which consume
the vegetative plankton (phytoplankton). Most fish depend on
the copepods and krill for their food supply, directly or indirectly.
Local and migratory seabirds depend on the fish, just as they
do in the north of Scotland. It is not surprising, therefore,
that seabirds have borne the brunt of this new food chain collapse,
as they did in the northeast Atlantic.
In the Farallon Islands,
about 40 km (25 miles) off San Francisco, seabird nesting has
plummeted. According to the Point Reyes Bird Observatory Director
of Marine Ecology Bill Sydeman, "We expect zero nesting
success" for the Cassin's auklets, a seabird which breeds
on the islands. "We've never seen anything like it"
(quoted in Martin, 2005). The 2005 Farallon Islands auklet breeding
failure was repeated in 2006. Despite thousands of nesting birds,
not a single auklet chick was hatched (Schwing, 2006). Biologists
believe this breeding failure is directly attributable to the
birds' poor nutrition. Other seabird groups have also been significantly
affected, a situation unprecedented in the thirty years of monitoring.
Further to the north, along the coast of British Columbia and
off Alaska, sea surface temperatures are the highest in fifty
years. Along the Oregon coast, these temperatures are 6°C
(11°F) higher than normal (Martin, 2005).
The plankton collapse
is attributed to a major slowdown of upwelling, in which cold
water carries nutrients up from the ocean bottom. Without the
influx of nutrients, phytoplankton fail to thrive and their numbers
are greatly reduced. This affects all organisms above them on
the food chain, including fish, seabirds, marine mammals, and
even Humpback and Blue whales (Martin, 2005). Because seabird
nesting is easily observed, its decline is an obvious sign of
serious trouble in the coastal environment. But the count of
certain salmon stocks are down as well -- by as much as a hundredfold
(Martin, 2005).]
|
The salinity of the Atlantic Ocean is
also changing (Curry, 2003). Over the four decades between the
1950s and the 1990s, water closer to the poles has become fresher,
and that of the tropics has become saltier. The more poleward
water has freshened because of increasing melting of the Greenland
and Antarctic ice caps and Arctic and Southern Ocean sea ice.
The increase in tropical water salinity is due to increased evaporation:
an additional two meters (yards) of water evaporated over the
four decades. This represents a five to ten percent rise in the
evaporation rate in just 40 years (Curry, 2003).
Both the poleward and tropical changes
are presumptively due to global warming. Indeed, between 50°S
(about the latitude of southern Argentina) and 60°N (the latitude
of the southern tip of Greenland), upper ocean temperatures in
the western Atlantic (near the Americas) have risen about 1.0°C
(1.8°F). An increase in equatorial precipitation near the
African coast, possibly also due to global warming, has also been
noted (Curry, 2003).
|
Hurricane Katrina and Global Warming
(The Saffir-Simpson Hurricane Scale
divides hurricanes into five categories, according to wind strength.
A tropical storm becomes a hurricane when its winds exceed 119
kilometers/74 miles per hour. Category 1 hurricanes have winds
from 119 to 153 kilometers/74-95 miles per hour; Category 2,
154-177 km/96-110 mph; Category 3, 178-209 km/111-130 mph; Category
4, 210-249 km/131-155 mph; Category 5, over 249 km/155 mph.)
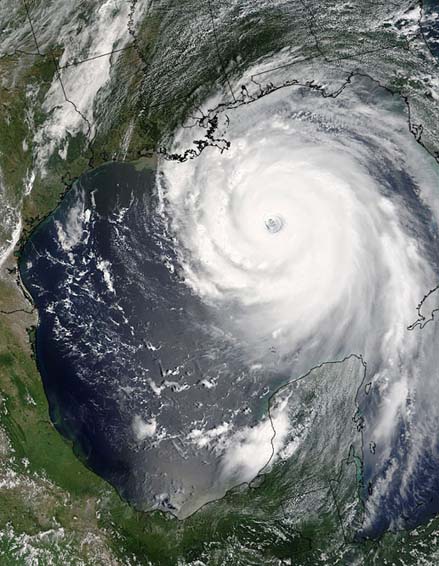 Hurricane Katrina as it approached
the Gulf Coast on August 28, 2005 (NOAA).
Hurricane Katrina as it approached
the Gulf Coast on August 28, 2005 (NOAA).
Hurricane Katrina crossed the southern
tip of the Florida peninsula on August 25, as a Category 1 hurricane,
and gathered strength to Category 5 during the next three days
in the Gulf of Mexico. It then lost some of that strength, to
Category 4, as it made landfall in Louisiana on August 29. Passage
to the north over land quickly dissipated its strength, so that
by August 30, it had become, once again, a tropical storm, just
as it had been on August 24 before hitting Florida.
Hurricane Katrina was a particularly
nasty hurricane, which dropped enough water into Louisiana's
Lake Pontchartrain to breach the levees surrounding the City
of New Orleans. Inadequate maintenance of these levees, together
with shoddy emergency preparations resulted in the flooding of
about 80% of the city, and major destruction along the nearby
Gulf Coast. The total cost of the hurricane is esttimated to
be between $125 and $150 billion dollars, making it the costliest
natural disaster in American history.
Shortly after this colossal natural
disaster, the Wall Street Journal ridiculed the idea that there
was any connection between Hurricane Katrina and global warming.
Let's examine the facts.
First, there is no way to attribute
any particular unusual weather event to a specific or single
source. One need only to consider the accuracy of television
and newspaper forecasts to recognize that if the causes and effects
of particular weather events were well understood, we would never
be caught without our umbrellas when it rains. The significant
inaccuracy of such forecasts, as well as their inability to project
more than a few days into the future, ought to convince us that
scientific weather prediction accuracy is still an elusive goal
(whatever the folks at the Old Farmers Almanac may think).
General patterns, however, are often
known to a fair degree of accuracy. A given area may typically
have about two dozen days each year when temperatures exceed
38°C (about 100°F). Over many years, this pattern may
hold. Nonetheless, there may be exceptional years when the number
of hot days is considerably greater than two dozen, or, indeed,
when there are no hot days at all. Careful study of weather patterns,
together with mathematical modeling, can even give us some sense
of how likely it may be for a given year to depart from the general
pattern. Both trends and cycles may also alter an established
pattern, and again, these departures from the initial pattern
may suspected or predicted.
One hurricane cycle has recently been
identified. According to the US National Atmospheric and Oceanic
Administration (NOAA), the number of hurricanes has been increasing
as part of a natural cycle. The cycle seems to run for forty
to sixty years; the number of hurricanes has been above average
since about 1995. Indeed, as part of that cycle, the number of
hurricanes forecast for 2005 is twice that of normal. So as many
hurricanes may follow Katrina as preceded it, before the hurricane
season ends on November 30.
But even if the 2005 hurricane season
is part of a natural cycle, it is characterized by a number of
exceptional events. The year 2005 marks the first time there
have been four named storms as early as July 9th since record
keeping began in 1851. (Tropical storms get names when their
wind speeds exceed 62 kilometers (39 miles) per hour.) The 26
named storms as of the end of the 2005 hurricane season exceed
the previous record number of 22, and the naming system, for
the first time, has had to extend into the use of Greek letters
as hurricane designates. In addition, the year 2005 also marked
the earliest Category 4 hurricane (Hurricane Dennis) on record.
The 14 tropical storms whose wind speeds achieved hurricane status
are also an annual record (the previous record was 12). Finally,
Hurricane Wilma brought more than 162 centimeters (64 inches)
of rain to Isla Mujeres, an all-time 24-hour rain record for
the country of Mexico. (Though 2005 is likely to prove to be
an exceptional year for hurricanes, it may nonetheless be part
of a general trend to more numerous and ferocious hurricanes.
The real significance of the 2005 hurricane season will only
be clear from the perspective of a decade or more hence.)
Is any of this unusual activity attributable
to global warming?
One of the predictions by those who
study global warming is that the number and severity of unusual
precipitation events will increase as the planet warms. Hurricanes
are unusual precipitation events. Although it is too soon to
assess whether the exceptional number of hurricanes predicted
for 2005 and thereafter are truly part of a natural cycle, or
whether they are some of the early effects of global warming,
it may not be premature to suggest that the general severity
of hurricanes is indeed increasing due to that warming. Hurricanes,
after all, are colossal heat pumps, transporting vast quantities
of tropical heat to more temperate regions.
Intensity of precipitation
events and temperature
The data on
this bar graph comes from 100 weather stations worldwide. Some
stations (51 of them) are represented in blue; these are stations
where temperatures range from 3°C to 19°C (26.6°F
to 66.2°F). Other stations (37 of them) have temperatures
in the 19°C to 29°C (66.2°F to 84.2°F) range;
these are shown in pink. The hottest stations (12), with temperatures
between 29°C and 35°C (84.2°F to 95°F) are indicated
in red. All stations have an average of about 230 millimeters
(about nine inches) of seasonal precipitation.
The daily precipitation at these stations has been divided according
to amounts in tens of millimeters (each millimeter = 1/25th of
an inch). Thus, the first set of bar graphs on the left shows
how much of the total precipitation (of the 230 millimeters or
nine inches) falls in events where the amount is about 10 mm
(about 0.4 inch). For the coolest stations (blue), over 30% of
total precipitation falls in such events. But for the warmest
stations (red), less than 20% falls in these limited precipitation
events.
Now look at the right side of the graph. Here is the symbol >100,
meaning that these are precipitation events where more than (>)
100 millimeters falls in a day. For the coolest stations (blue),
only a percent or two of total precipitation falls in such events.
But for the warmest stations (red), a much higher percentage
(4-5%) of total precipitation falls in such precipitation events.
The message of the graph is this: that in warmer conditions,
even with the same total amount of precipitation falling, precipitation
tends to be concentrated into bigger precipitation events. In
a warmer world, therefore, we ought to expect more severe precipitation
events, even if the total amount of precipitation remains the
same. But, of course, a warmer atmosphere will hold more moisture,
and the severity of extreme precipitation events will be even
greater (Karl and Trenberth, 2003).
A new computer model
of projected extreme weather events for central North America
during the next century seems to confirm these forecasts. Using
five months worth of supercomputer time and enormous amounts
of data, the resulting maps show in great detail the anticipated
changes in extremely hot and cold events, as well as in extreme
precipitation events. While the number of extremely cold events
drops significantly, as would be expected in a warmer world,
both the number of extremely hot events and the number of extremely
wet events increases, in some cases quite significantly. For
example, the desert Southwest will experience more than five
times as many heat waves, and they will be of as much as five
times longer duration than those of today. The northeastern US
will experience heat waves typical of the summer's two hottest
weeks -- but extending over two months. Even those parts of the
US which usually have the fewest extremely hot events will have
twice as many. The Gulf Coast, battered by hurricanes in the
past few years, will not only have more heat waves, but also
more rain and stronger precipitation events. Assuming that the
model's projections can be extended to the nearby Gulf waters,
that is a prescription for more, and more intense, hurricanes.
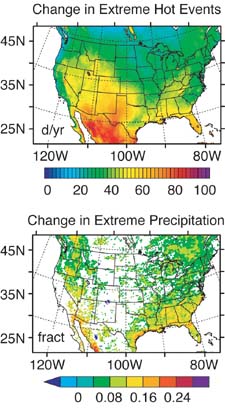 Extreme weather
event changes in central North Ameica over the century. The upper map shows projected
changes in the number of extremely hot days. Some parts of the
Southwest will have almost three months more heat waves than
at present. The lower map indicates the projected increase in
extreme precipitation events, as a fraction of today's extreme
precipitation events. (Thus, 0.08 represents an 8% increase in
extreme precipitation events; 0.16, a 16% increase, and 0.24.
a 24% increase.) Worst hit will be the Gulf Coast (Diffenbaugh,
2005; Boutin, 2005).
Extreme weather
event changes in central North Ameica over the century. The upper map shows projected
changes in the number of extremely hot days. Some parts of the
Southwest will have almost three months more heat waves than
at present. The lower map indicates the projected increase in
extreme precipitation events, as a fraction of today's extreme
precipitation events. (Thus, 0.08 represents an 8% increase in
extreme precipitation events; 0.16, a 16% increase, and 0.24.
a 24% increase.) Worst hit will be the Gulf Coast (Diffenbaugh,
2005; Boutin, 2005).
That the general severity of hurricanes
may be increasing is the conclusion of a study published early
the same month as Hurricane Katrina ravaged New Orleans. (Hurricane
Katrina was not an exceptionally severe hurricane, though it
was exceptionally large and struck in a particularly vulnerable
and inadequately prepared area. However, a later hurricane of
the 2005 season, Wilma, briefly became the most intense Atlantic
hurricane ever recorded. It went from a tropical storm, with
maximum winds of 119 kilometers/74 miles per hour to a category
5 hurricane, with winds over 249 km/155 mph, in a single day.)
According to the study (Emanuel, 2005a), the severity of hurricanes,
as measured by wind speeds and duration, has increased by some
50% over the course of the last 30 years. (This study found no
evidence for an increase in the number of hurricanes.) Things
could be worse: the same study indicates that storms in the northern
Pacific have increased in strength by 75% during the same period
of time. Though this study has its critics (see Landsea, 2005,
and Pielke, 2005), its author stands by his conclusions, noting
that they are based on about 100 times more data than those of
his critics, rather than just hurricane wind speeds at landfall
(Emanuel, 2005b).
A second study confirms that the percentage
of intense hurricanes has increased over the past 35 years, even
while the total number of hurricanes, and their maximum wind
speeds (at about 290 kilometers per hour/180 mph), has remained
roughly the same. In those 35 years, the number of the most intense
hurricanes (categories 4 and 5), has almost doubled, and that
number, as a percentage of all hurricanes, has risen from about
20% to about 35%. The same period has seen a decline in the number
and percentage of weaker (categories 1, 2, and 3) hurricanes
(Webster, 2005).
 |
|
Hurricane intensity, 1970-2004. This graph shows the changes in hurricane intensity
for all oceans (in some parts of the world, hurricanes are known
as cyclones or typhoons). The yearly data has been grouped into
"pentads," that is, groups of five years. This is a
statistical method used to reduce the influence of exceptional
years on the results, and to make general trends more visible
(Webster, 2005). |
Some scientists challenge these conclusions.
But as scientists, it is their duty to demonstrate that the conclusions
do not follow from the evidence, or that there is contravening
evidence. At this point, the conclusions stand.
And there may be good reason that they
should. The increase in intensity of major storms over recent
decades seems closely tied to the increase of ocean surface temperature
during the same time. According to Kerry Emanuel, the lead author
of the study, "'The total energy dissipated by hurricanes
turns out to be well correlated with tropical sea surface temperatures.
The large upswing in the past decade is unprecedented and probably
reflects the effects of global warming'" (quoted in Verrengia,
2005). Storm intensity is measured by wind speeds and storm duration.
[It should be noted that both the hurricane intensity study and
Emanuel's comments date from several weeks before Hurricane Katrina
struck.] The strong link between hurricane intensities and sea
surface temperatures (as opposed to other possible influential
factors) received additional confirmation in a study published
in March of 2006. The link was found in all oceans that have
such storms (Hoyos, 2006).
Over the past 40 years, the upper ocean
(down to about 300 meters/yards) has warmed -- as a result of
the heating of the atmosphere by greenhouse gases -- by an average
of 0.5°C (0.9°F: Barnett, 2005). This warming is present
in all oceans to a greater or lesser degree, according to independent
studies with millions of data points (Levitus, 2000; Levitus,
2001; Levitus, 2005).
Warmer oceans contain more heat, which
drives hurricanes; they also evaporate more water, adding to
the severity of precipitation events. So there is a specific
cause and effect relationship between oceanic warming and hurricane
intensity. Consequently, it would be surprising if hurricane
intensity had not increased as a result of oceanic warming. One
would have to wonder why the predicted effect had not occurred
when the causative agent was present. It would be rather like
dropping a stone, only to have it float in the air.
So, did global warming specifically
contribute to the size and ferocity of Hurricane Katrina?
Most likely, yes. Both the North Atlantic,
in which Katrina formed, and the Gulf of Mexico, where it grew
to a major hurricane, have been warmed by the action of anthropogenic
greenhouse gases. The Gulf of Mexico, for example, was 2°C
to 3°C (3.6°F to 5.4°F) warmer in early August than
is usual for that time of year (Schiermeier, 2005c); seawater
temperatures there were unprecedented. This allowed Katrina to
suck "so much heat from the gulf that water temperatures
dropped dramatically after it had passed, in some regions from
30°C to 26°C" [86°F to 78.8°F] (Schiermeier,
2005c).
Both Katrina and the next major hurricane
to hit the US mainland in the 2005 hurricane season, Rita, seem
to have drawn their increased strength while passing over a "loop
current" or its giant eddies in the Gulf of Mexico. This
current carries warm water from the Caribbean through the Yucatan
Channel (the passage between the Yucatan Peninsula and western
Cuba), into the Gulf, and then out into the Atlantic via the
Straits of Florida (between Florida and northern Cuba). The loop
current and its eddies provide a deep (to water depths of 100
meters/yards or so) source of heat upon which passing tropical
storms or weaker hurricanes can build into major hurricanes (Revkin,
2005).
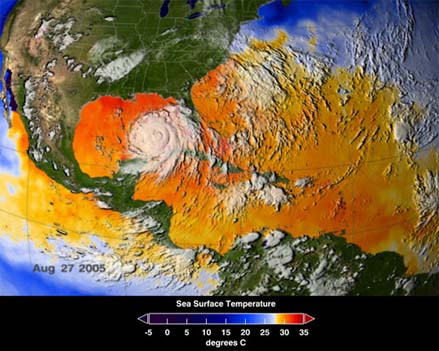 Sea Surface Temperatures
on August 27, 2005, as Hurricane Katrina approached the Gulf
Coast. Hurricanes require minimum
temperatures of about 26°C (78.8°F) in order to form.
Sea surface temperatures can only provide a general indication
of hurricane building potential, however, because hurricanes
draw their strength from waters as deep as many tens of meters/yards
(NOAA).
Sea Surface Temperatures
on August 27, 2005, as Hurricane Katrina approached the Gulf
Coast. Hurricanes require minimum
temperatures of about 26°C (78.8°F) in order to form.
Sea surface temperatures can only provide a general indication
of hurricane building potential, however, because hurricanes
draw their strength from waters as deep as many tens of meters/yards
(NOAA).
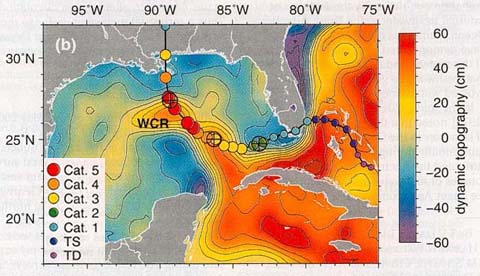 Deeper water temperatures
and Katrina. Although rising
sea surface temperatures are generally correlated with increased
hurricane intensity, hurricanes draw their strength from more
than just the surface of the ocean. Deeper ocean warmth is required.
This satellite image shows why Katrina evolved into a major hurricane
(and also why it lost strength just before reaching the Gulf
Coast). Instead of showing sea surface temperatures, it displays
the relative height of the ocean surface. Reds and yellows indicate
a somewhat greater height to the sea surface, as measured in
centimeters (2/5 of an inch). Because water expands as it warms,
a higher sea surface indicates that the water below is generally
warmer than in areas where the sea surface is lower (and the
water below is therefore cooler). The image clearly shows the
loop current which swings out of the Caribbean to the south,
into the Gulf of Mexico west of Cuba, and then moves east between
Cuba and Florida. A large blob of warm water, called a warm-core
ring (WCR) has spun off the loop current. Katrina's path (from
right to left in this image) took it over the loop current, and
then over the warm-core ring, which enormously strengthened the
storm's intensity. (TS = tropical depression; TS = tropical storm;
please disregard the larger circles with crosshairs, which refer
to another diagram. Scharroo, 2005).
Deeper water temperatures
and Katrina. Although rising
sea surface temperatures are generally correlated with increased
hurricane intensity, hurricanes draw their strength from more
than just the surface of the ocean. Deeper ocean warmth is required.
This satellite image shows why Katrina evolved into a major hurricane
(and also why it lost strength just before reaching the Gulf
Coast). Instead of showing sea surface temperatures, it displays
the relative height of the ocean surface. Reds and yellows indicate
a somewhat greater height to the sea surface, as measured in
centimeters (2/5 of an inch). Because water expands as it warms,
a higher sea surface indicates that the water below is generally
warmer than in areas where the sea surface is lower (and the
water below is therefore cooler). The image clearly shows the
loop current which swings out of the Caribbean to the south,
into the Gulf of Mexico west of Cuba, and then moves east between
Cuba and Florida. A large blob of warm water, called a warm-core
ring (WCR) has spun off the loop current. Katrina's path (from
right to left in this image) took it over the loop current, and
then over the warm-core ring, which enormously strengthened the
storm's intensity. (TS = tropical depression; TS = tropical storm;
please disregard the larger circles with crosshairs, which refer
to another diagram. Scharroo, 2005).
Without global warming, Katrina may
still have formed and devastated the Gulf Coast, but its size
and the force of its winds would likely have been reduced. The
massive storm surge which swept over and obliterated several
towns along the Mississippi coast would not have been as high
as it was (about 10 meters/31 feet in places), and would have
swept less far inland.
The general evidence suggests that if
Hurricane Katrina was typical of more recent hurricanes, its
devastating force was some 50% greater as a consequence of global
warming than it would have been otherwise. That's no small difference.
The 2006 Hurricane Season:
Despite the horrific hurricane seasons
of 2004, when three major hurricanes hit the United States mainland,
and that of 2005, when another three -- in addition to Katrina
-- hit the mainland, the 2006 season was unexpectedly quiet.
Not a single hurricane came ashore, and storm activity extended
only as far westward as the central North Atlantic. What happened?
One or both of two factors may have
been involved. The first is called wind shear, and refers to
the shearing force that is exerted when winds move at greatly
varying speeds or directions at different altitudes. Because
hurricanes are weather structures which extend from the ocean
surface to at least sixteen kilometers (ten miles) high, wind
shear has the ability to tear them apart. And, just as hurricane
intensity is predicted to increase in a warming world, so also
is wind shear. The same cause, therefore, can result in conflicting
atmospheric phenomena. Nonetheless, according to predictive models,
wind shear seems likely to increase at a slower rate with global
warming than will hurricane intensity. Whether the predicted
increase in wind shear will be sufficient to rip apart many future
hurricanes, or reduce their intensity, remains to be seen.
A second factor possibly impacting hurricane
number and intensity may be dust from the Sahara Desert. Most
North Atlantic hurricanes do begin their existences off the coast
of northwestern Africa, as tropical low-pressure centers ("tropical
depressions"). As they move westward across the North Atlantic,
they can gain intensity from the warm water of the ocean. If
the ocean water is cool, however, the conditions for increasing
storm intensity are not met (Lau and Kim, 2007; Kerr, 2007).
In 2006, unusually large quantities
of dust from the Sahara were carried over the North Atlantic.
This dust had the effect of blocking sunlight and reducing the
solar heating of the ocean, dropping its temperature. In addition,
the arid winds carrying the dust may have helped dry the marine
air and increase wind shear. The 2006 season of low storm intensity
may have been the consequence (Lau and Kim, 2007; Kerr, 2007).
What will the future bring, as the competing
influences of globally warming sea surface temperatures, wind
shear, and dry, dusty winds vie for supremacy over the southeastern
North Atlantic? Stay tuned.
|
As we have been repeatedly warned by
geochemist and climatologist Wally Broecker (for example, Broecker,
2001), the increasing freshening of poleward waters, and the increasing
salinity of tropical waters, can slow or shut down the Great Oceanic
Conveyor (for a discussion of thermohaline circulation, see APPENDIX 3: THERMOHALINE CIRCULATION). There is, in fact,
some evidence of just such a slowdown, in the subpolar North Atlantic
during the 1990s (in contrast to the late 1970s and 1980s), though
its cause is unclear. Lacking needed data from prior to 1978,
when satellite monitoring of the oceans began, it cannot be determined
if the slowing circulation is part of a normal decade-long cycle,
or due to a warming of the water involved in that circulation
(Häkkinen and Rhines, 2004).
But measuring the flow of the various
Atlantic currents which contribute to the Great Ocean Conveyor
has proven quite difficult. One study, relying on direct ocean
measurements rather than those by satellite, found a significant
(50%) reduction in the southward flow of North Atlantic Deep Water
(NADW), a critical component of oceanic thermohaline circulation.
Based on five oceanographic surveys made between 1957 and 2004
(1957, 1981, 1992, 1998, 2004), the study also found that half
of the Gulf Stream's water failed to reach the Atlantic's far
north (Bryden, 2005; Kerr, 2005).
Such surveys, using data from instruments
which measure water density lowered from oceanographic ships,
are nonetheless subject to quite high levels of uncertainty, and
indeed, have failed to be confirmed. A new system of satellite-linked
oceanographic buoys, strung across the mid-North Atlantic, now
shows that marine circulation is much more variable than previously
suspected. The new data suggest that it may be decades before
a clear pattern emerges (Kerr, 2006). Nonetheless, an IPCC prediction
indicates that the thermohaline conveyor may slow by as much as
25% by 2100 (Schiermeier, 2006).
It had been thought that a slowdown or
shutdown would have enormous consequences for human populations
living on both sides of the North Atlantic through the cooling
that would ensue when warmer waters did not reach the far north
(Broecker, 2001). Though such cooling could not induce a new ice
age (though some have mistakenly thought so), it could nonetheless
be precipitous. In particular, it was noted that in one Ice Age
episode, Greenland temperatures fell by 10°C (18°F) in
just a decade (Kerr, 2004). But now that we have a better understanding
of the rapidity with which global warming will overtake us, the
North Atlantic deep freeze scenario has now been dismissed as
unlikely. It will not be cold about which those in northern Europe,
eastern Canada, and the northeastern United States will have to
be concerned, but warming itself, just like everyone else.
As the planet continues to warm, so will
the oceans. The Southern Ocean, at mid-depths, has warmed by 0.17°C
(about 0.3°F) since the 1950s (Gille, 2002). New data from
the North Pacific confirms that even at great depths, 5000 meters
(three miles) and below, seawater temperature has risen by 0.005°C
(0.009°F). This is a tiny change, but it occurs where there
should be no change at all. And it occurs across the entire North
Pacific, a distance of many thousands of kilometers (several thousand
miles), from off Washington state to Japan, as surveyed mostly
along latitude 47°N. (The distance is approximately one-quarter
of the circumference of the globe at the latitude surveyed.) And
the warming occurred in just 14 years, between 1985 and 1999 (Fukasawa,
2004).
There should be no change in deep-ocean
temperatures because the deep ocean is quite isolated from the
upper ocean, at least on short time scales. This deep ocean water
should not have been in contact with the surface in 800 years
(Davidson, 2004). Textbook time for ocean mixing -- the amount
of time it takes for a mass of ocean water to blend with other
ocean water -- is 1000 years. This slow rate, and the isolation
of deep water from the surface, means that there should have been
no warming whatsoever in the period studied. The fact that there
has been such warming is a matter of surprise and concern -- and
even alarm -- to oceanographers.
The oceans are the roach motel of global
warming. In the case of the oceans, it is heat which checks in
but doesn't check out. Water has an extraordinary heat capacity.
In other words, it holds heat better than almost anything else.
That means that when the oceans warm, they lose that heat only
slowly and reluctantly. Ocean heat stays around for a long time.
And most of the heat from global warming -- over 90% -- goes into
the oceans.
And the oceans hold 99% of the world's
supply of methane hydrate; the rest is in permafrost. Inevitably,
in a warming world, hydrate methane will also be released from
permafrost, but its quantity pales to insignificance compared
to that in the oceans. Moreover, it is not merely hydrate methane
that will be released, but also free methane from below the BSR.
The New BSR
It used to be thought that the depth of the methane hydrates within
the ocean floor sediments would delay and perhaps prevent methane
release with global warming. This thinking was based on the amount
of time it would take for warmth from the overlying ocean to penetrate
the sediments, and upon scientific understanding of the physical
contours of the methane hydrate deposits. The bottom simulating
reflectors (BSRs) that marked the boundary between the overlying
hydrate and the underlying free methane closely mimicked the contours
of the ocean floor (hence their name), though generally several
hundred meters deeper.
These contours were fairly smooth and
gently rolling (see the sonar image of the "old" BSR,
above, in the Methane and Methane Hydrates, Part 2, section),
and the upper boundary of the hydrate was similarly presumed to
be relatively smooth. Because this hydrate methane was thought
to be located well below the seafloor, it was assumed that heat
from global warming would take a long time to penetrate that far,
and that any significant release of margin methane would take
place at least hundreds (Kvenvolden,1988a), and perhaps thousands
of years in the future. Even employing "worst case estimates,"
little methane release was presumed to be possible, because about
98% of methane hydrate is found in sediment conditions which would
require a 4°C (7.2°F) warming to dissociate (Harvey and
Huang, 1995).
Such findings could provide consolation
to those concerned about the possibility of a near-term methane
catastrophe, were it not for the qualifying statement heading
a list of conclusions: "In the absence of fracturing or sediment
failure..." (Harvey and Huang, 1995). If fracturing or sediment
failure were indeed possible, the comforting conclusions would
not be valid. In fact, however, fracturing and slumping (sediment
failure) turn out to be the major modes by which large quantities
of hydrate methane can be released.
New, more detailed sonar images have
completely changed our understanding of BSR topography. Instead
of being fairly smooth and gently rolling, the BSR surface is
now known to be punctuated with sharp, needle-like peaks, columns,
and discontinuous knife-edge ridges, which may extend all the
way up to the top of the sediment. These features apparently represent
escape routes for free and dissociated methane, which at times
follows "chimneys" (the needle-like peaks and columns),
and at others follows faults (the knife-edge ridges) through the
consolidated sediments (Wood, 2002; Pecher, 2002). [Sonar image
from Wood, 2002.]
These escape routes are apparently in
regular use. If they were not, we would expect that the free gas
below the hydrate would gradually accumulate and build up pressure.
Eventually, the pressure would lead to a blowout, and explosive
release of the gas from its trap under the hydrate. Though such
blowouts may occur occasionally, they are probably not common,
because the faults and chimneys allow methane to escape from below
the hydrate. The escape routes serve as safety valves.
A careful examination of the pressure
of the free gas below the hydrate on several passive margins shows
it to be essentially identical to the pressure needed to pry open
overlying faults (Hornbach, 2004). This pressure is referred to
as the critical pressure, and the amount of free methane under
the hydrate is, in passive basins, at critical pressure. Free
gas tends to remain at critical pressure because it forces open
the safety valve when the pressure of the gas exceeds the critical
pressure. When the free gas is at less than the critical pressure,
the safety valve remains closed.
Seafloor faults thus seem to be highly
responsive as pressure safety valves. In those active margins
where oceanic plates are subducting beneath continents, the pressure
being applied to the wedge of sediments piled against the continent
(the accretionary wedge) forces fluids up through the hydrates.
This process, called hydraulic fracturing, creates temporary pathways
through the sediments, and allows free and dissociating methane
to escape (Zühlsdorff and Spieß, 2004).
Because many active continental margins
are being compressed by the forcing together of tectonic plates,
it is not surprising that faulting and fracturing should be common
there. On passive margins, by contrast, faulting should be much
less. Therefore, there should be less free gas, and less pressure,
under hydrate on active margins than on passive ones. And, indeed,
that is the case: on the Blake Ridge off the Florida-Carolina
coast (a passive margin), the free gas column is 200 to 250 meters
(yards) thick. Other passive basins display similar free gas column
heights. But the free gas columns in active margins are much less:
typically about 35 meters thick, they rarely exceed 50 meters
(Hornbach, 2004).
Sonar images of an active margin area,
off the west coast of Canada's Vancouver Island, reveal the same
sort of wipeout zones (transparent to sonar: here they are referred
to as "blanking zones"; Zühlsdorff and Spieß,
2004), as reported elsewhere (Wood, 2002). The seafloor surface
exhibits a pockmark, a familiar sign of fluid venting, with massive
gas hydrate lying at only 3 to 8 meters (yards) depth (Riedel,
2002). It is presumably the process of hydraulic fracturing which
allows a rather free flow of methane out of the hydrate zone,
and prevents the buildup to critical pressures found in passive
margins and basins. The process, in fact, may be important for
methane release in all margin settings (Zühlsdorff and Spieß,
2004).
Thus free methane, as well as hydrate,
extends in places to, or almost to, the seafloor, where it can
be -- and presumably is -- released into the ocean. This means
that at least part of the oceanic methane reservoir is much more
accessible to warming than previously thought. The gas chimneys
and faults that serve as escape routes for methane are therefore
likely to be highly responsive to the oceanic warming that is
accompanying global warming generally. Consequently, assumptions
about the relative remoteness and inaccessability of oceanic hydrates
will have to be scrapped. Clearly, methane hydrates and the free
methane below them are considerably more vulnerable to warming
than was previously presumed. Most dismayingly, there may be little
lag time -- or even no lag time whatsoever -- between ocean bottom
warming, and the initiation of seafloor methane release in response.
Inevitably, then, with the amount of global warming projected
to occur in the next century or so, most or all seafloor methane
will be released. Exactly how fast that release will take -- and
how catastrophic that release will therefore be -- is something
that can at best be only dimly glimpsed. Clearly there are some
critical parameters which are unknowable or must be guessed at.
Magnitude
Initially, methane from hydrate will slowly trickle out of the
sediments as the oceans warm. In fact, some undoubtedly is trickling
out right now, contributing (along with other sources such as
the increasing number of ruminants and increasing rice cultivation)
to the slow rise of methane detected in the atmosphere. At some
point, however, the gradual mode of methane release is likely
to shift to a pattern of more abrupt, episodic releases, as oceanic
warmth penetrates more deeply into the sediments. There will be
rapid depressurization of hydrate at the base of the hydrate stability
zone because of the release of free gas through warmed chimneys,
leading to hydrate dissociation and release. Or there will be
a submarine landslide, triggered by the melting of the hydrate
and the consequent destabilization of deep sediment, or by an
earthquake once the hydrate has been brought to the point of destabilization
by the warming.
(A triggering earthquake could be just
an ordinary quake, which are common on active continental margins
-- hence their description as "active" -- or could actually
be the result of the warming, which would increase the weight
of the overlying water on continental slopes. Warming increases
the water weight on the continental margins, including the slopes,
because it causes the thermal expansion of water. Thermal expansion
means that the volume of the water increases, but not its total
weight, which remains the same. But since this increased volume
is proportionately greater over the shallower portions of the
ocean, the weight of water there increases, while the weight decreases
in the deep ocean where the volume increase is proportionately
smaller. See the diagram of the thermal expansion of water in
the Methane and Methane Hydrates section.)
During the initial phases of more episodic
releases, the rate of methane release will sharply increase. If
the release is caused by a submarine landslide, most of the associated
methane will be released in less than a day. If close to shore,
the slide may produce a significant tsunami.
Tsunamis
A tsunami is just another unpleasant possible effect of a submarine
landslide. In 1998, a 7.1 earthquake caused about 4 cubic kilometers
(a cubic mile) of sediment to slide down a 25° seafloor slope
a short distance offshore from the southwestern Pacific island
of Papua-New Guinea. A 7 to 10 meter (yard) high tsunami (perhaps
as high as 15 meters/50 feet in the area hardest hit) inundated
the shore just moments later, sweeping away several villages and
over 2000 coastal inhabitants (Chang, 2002).
 The Great Wave off Kanagawa. This famous Japanese woodblock print is one
of Katsushika Hokusai's "36 views of Mt. Fuji," and
dates from about 1830. That's Mt. Fuji (Fujiyama) in the background.
Kanagawa is a prefecture (district) of Japan, bordering on Toyko
Bay. Although I am not sure whether the wave depicted is actually
a tsunami, it could be: Tokyo Bay is an enclosed bay which could
enhance the height of a tsunami as it crashed toward shore. (From:
www.adachi-hanga.com/hp_english/en_image1/L_003.gif)
The Great Wave off Kanagawa. This famous Japanese woodblock print is one
of Katsushika Hokusai's "36 views of Mt. Fuji," and
dates from about 1830. That's Mt. Fuji (Fujiyama) in the background.
Kanagawa is a prefecture (district) of Japan, bordering on Toyko
Bay. Although I am not sure whether the wave depicted is actually
a tsunami, it could be: Tokyo Bay is an enclosed bay which could
enhance the height of a tsunami as it crashed toward shore. (From:
www.adachi-hanga.com/hp_english/en_image1/L_003.gif)
Tsunamis caused by submarine landslides
are not uncommon. (The December 2004 tsunami which devastated
countries around the Indian Ocean was not caused by a submarine
landslide, but by a magnitude 9.0 earthquake off the Indonesian
island of Sumatra. The earthquake caused a huge movement of the
seafloor, and it was this movement which produced the tsunami.)
Usually their effects are confined locally, though this depends
on the magnitude of the slide and its proximity to the coast,
among other factors. Larger landslides do cause bigger tsunamis,
other things being equal. And depending on their size, tsunamis
may have regional or even hemispheric rather than merely local
effects.
In November 1929, a 7.2 magnitude earthquake
south of the coast of Newfoundland caused a significant undersea
slump which cut a dozen transatlantic telecommunication cables
from North America to Europe. It is estimated that the slump carried
between 300 and 700 cubic kilometers (about 70 to 170 cubic miles)
of sediment.
Originating on the continental slope,
the Grand Banks slide tore asunder some half dozen cables, and
the turbidity current -- a slurry of seawater and sediment --
that it engendered ripped apart an additional six. Every cable
was broken in at least two places more than a hundred and sixty-five
kilometers (a hundred miles) apart, indicating both the great
width of the slide and turbidity current, and its speed, estimated
at its origin as eighty to one hundred kilometers (about fifty
to sixty miles) an hour. Despite continuously depositing its load
of sand, mud and silt, the turbidity current still retained enough
force to sever a final cable over 800 km (500 miles) seaward (Heezen,
1952).
The height of the resulting tsunami was
7 meters (22 feet). But bays and harbors, because of their constricted
shape, tend to channel tsunamis to more destructive heights as
they funnel inland. This fact is reflected in the name "tsunami,"
a Japanese word composed of "tsu" meaning harbor, and
"nami" meaning wave. In the case of the Newfoundland
tsunami, the channeling effect caused wave heights to run up to
as high as 13 meters (40 feet) in some bays, destroying fishing
vessels and harbor buildings and killing about 28 people (Ruffman,
2001).
Though the Grand Banks slide was probably
the result of the earthquake shaking of waterlogged sediments,
some submarine landslides very likely or certainly have involved
free methane gas and methane hydrate, as did the Storegga slide
mentioned previously. The East Coast of the United States holds
its own methane-related hazards, and as scientists have come to
know the marine world better, these hazards have become clearer.
The relic of a major slide, roughly equivalent in volume to that
of the 1929 slide off Newfoundland, has been found off the coast
of North Carolina. Estimated to have taken place about 20,000
years ago, the Albemarle-Currituck slide is of ice age vintage,
though it presumably was not triggered either by the weight of
the glaciation or by glacial rebound, as there was no continental
ice sheet within hundreds of miles.
Recently marine geologists discovered
cracks on the outer edge of the continental shelf (at the "shelf-slope
break") along the Virginia-North Carolina coast to the north
of the Albemarle-Currituck slide. Similar cracks have also been
found on the edge of the continental shelf off New Jersey. On
the North Carolina-Virginia shelf edge, these cracks have caused
the shelf edge to slump down as much as 50 meters (160 feet)(Driscoll,
2000). On closer inspection, however, the cracks have proven not
to be simple cracks at all, but elongated craters as much as two
by five kilometers (about 1.2 by 3 miles) in extent (Simpson,
2000).
These craters may be evidence of the
rapid, or even explosive, expulsion of methane-laden fluids from
the upper slope sediments, and could contribute to slope failure,
resulting in major submarine landslides. Such landslides could
result in significant tsunamis along the central section of the
East Coast, the discoverers of the Virginia-North Carolina shelf
edge cracks have warned (Driscoll, 2000). A rapid slope failure
similar in volume to that of the Albemarle-Currituck slide could
set loose a tsunami up to several meters (yards) high, equivalent
to storm surges from major hurricanes.
As with major storm surges, the actual
devastation that an East Coast tsunami would cause would depend
on the topography of the coast where it hit, together with the
height of the tide at the time. (The northern part of the American
East Coast may be particularly vulnerable because it has numerous
estuaries -- Chesapeake Bay, Delaware Bay, New York Harbor --
which can channel water to major low-lying population centers.)
But in important respects tsunamis differ from the water rise
of a storm surge. First and perhaps most important, there would
not be the lengthy warning that accompanies the approach of a
hurricane.
Second, tsunamis are often preceded,
by several minutes to about a half hour, by an actual drawdown
of sea level of a few to several meters (yards). This surprising
precursor to a tsunami caused several deaths when it occurred
along the French Riviera in response to a submarine earthquake
about thirty years ago. Curious but unsuspecting bathers, lured
by the withdrawal of the Mediterranean and the exposure of sea
bottom normally unseen even at the lowest of tides, wandered out
far from shore. There they were caught when the actual tsunami
waves, several meters high, came rolling in a short time later.
This third and last difference between tsunamis and storm surges,
that of the rapid buildup and breaking of walls of water against
the coast, rather than the more gradual rise that accompanies
hurricanes, may come several minutes to an hour after the sea
has withdrawn (Driscoll, 2000).
Any continental slope landslide, however
triggered, has the ability to virtually instantaneously release
most of the methane from the landslide material itself. After
such a landslide, residual methane from the landslide scar would
be released for weeks to months afterwards. As with earthquakes
and aftershocks, an initial landslide event can trigger additional
slides, generally smaller than the initial slide, but with the
non-negligible possibility of an even greater slide. The amount
of the release, obviously, depends on the quantity of methane
that lay below the slide area.
There is no way to predict how large
the methane release from an initial slump might be. This depends
on initial conditions on the seafloor: the stability of the methane
hydrate-containing portion of the continental shelf in one place
versus another, the amount of oceanic warming in specific regions
of the ocean, the amount of hydrate and free gas in the affected
area. Oceanic areas close to the poles will be more vulnerable
to methane release for several reasons. First, their stores of
hydrate extend to shallower depths. Second, at shallower depths,
sediments are usually of more recent origin, are less compacted
and therefore less stable. Third, many of these areas are still
rebounding from the release of the weight of the great continental
ice sheets that lay upon them during the ice age. Fourth, global
warming is projected to warm high-latitude (near polar) areas
more than mid- or low-latitude (temperate or tropical) areas,
and indeed, it is already doing so.
By the time of an initial methane-related
slump, however, the amount of carbon dioxide in the atmosphere
and its resultant global warming will have well exceeded that
needed to trigger the initial event. In addition, the slump's
methane and its successor gas, carbon dioxide, will contribute
to further global warming, and the warming of the oceans may insure
that additional slides follow. Indeed, the slides may continue
intermittently over a period of hundreds to thousands of years.
Their number and severity will depend, as with the initial slide,
on factors such as slope stability, sediment consolidation and
water content, and regional fault activity, together with the
rate of oceanic warming and changes in global thermohaline circulation
and local currents.
Eventually the slumping must slow and
stop, because the warming of the sediment takes increasing time
with increased depth (Nisbet, 1990). As slumping slows, methane
input to the atmosphere will also decline, reducing and eventually
removing the source of the warming. By that time, of course, the
use of fossil fuels will have long ago ceased, if not from the
desire to prevent further damage to the planet, then because fossil
fuels will have been completely exhausted. At current rates of
use, most of Earth's petroleum will be gone in fifty years, natural
gas in sixty, and even coal, the supply of which is expected to
last some 300 years at current use rates, will be a distant memory.
Unpredictability
The two possible modes of catastrophically
rapid methane release, slumping and massive dissociation (combined
with the release of the free methane gas which lies below), are
each quite unpredictable, with regard to when each might begin,
how long the process might continue, and how much methane could
be released. The problem is compounded by the probability that
the two modes could be combined in many circumstances.
As oceanic temperatures rise, the warmth
will first begin to liberate the free gas and hydrate closest
to the sediment surface, in places (the "escape routes")
just a few tens of meters down. Reopening the escape routes (chimneys
and faults), will allow the further escape of free gas that is
buried more deeply under the main bodies of hydrate, hundreds
of meters below. This in turn will depressurize the hydrate at
its base, allowing its dissociation and release. Finally, this
increasing dissociation of hydrate will cause the destabilization
of the entire sediment pile, causing slumping.
Just as there is no way to predict how
much methane will be released in an initial seafloor slump, there
is no way to determine when an initial slump will occur. This
depends, in part, on how close particular areas are to threshold
conditions. A threshold is literally the sill of a doorway; it
is the point where one enters or leaves a house or room. A threshold
condition therefore is the place where change begins, from one
condition to another. The conditions are often quite different.
In the case of continental shelves, the threshold is between stability
and instability, between "just sitting there" and sliding.
Basically the situation with oceanic
slope stability is no different from snow avalanches, except that
we know vastly more about how snow behaves. Consequently, we employ
ski patrols to assess how close mountain snow is to the threshold
where it will let go, and we warn recreational skiers off slopes
when those slopes approach threshold conditions. With oceanic
continental slopes, however, we know vastly less about threshold
conditions, vastly less about the quantity and location of methane
hydrate and free methane that lie within the slopes, and have
vastly more area that would require assessment. Because of the
many uncertainties and high cost of such assessments, it seems
highly improbable that they would ever be done.
Irreversibility
The slumping of continental margins due
to the warming of methane hydrate differs in another, extremely
important way from snow avalanches. With snow avalanches, with
sufficient warning, not only can we warn people away, but we can
also trigger the avalanche ourselves by the use of explosives.
In many mountainous areas there are even artillery emplacements,
from which shells can be fired to cause avalanches to occur when
they may do so most safely. In other areas giant gas burners are
used to preemptively trigger avalanches. These measures can provide
some control over avalanches, at least in those places we monitor
and where we take remedial action. With hydrate-related submarine
slides, we have no such option, even if we had the advance warning
and the actual power to trigger such slumps, which we do not.
Advance triggering would only cause the problem we would be trying
to avert: the release of methane from the seafloor. Our one option
is prevention: stopping the slumping before it starts. And that
requires that we stop warming the planet.
Once massive dissociation and/or slumping
begins, there will be no way to stop them. Indeed, there will
be no way to stop these processes even from well before they start,
because of the lag time between increasing atmospheric carbon
dioxide and the warming of the globe and the seafloor sediments
in which the methane hydrates and free methane reside. As NASA
climate modeler James Hansen has pointed out, "even if rising
concentrations of greenhouse gases could be stabilized tomorrow,
gases that have already accumulated [in the atmosphere] will push
surface temperatures up another half degree or so" (Kerr,
2000), an assessment which is supported by others (Miehl, 2005).
This amount of additional warming is
known as the "warming commitment" because it represents
the amount of warming we are committed to, even without additional
carbon dioxide being dumped into the atmosphere. Some climate
modelers believe the present warming commitment is even greater
than Hansen and Miehl do, and that the planet could warm by another
1°C (1.8°F) over the next twenty years (Wetherald, 2001)
or more (Wigley, 2005). As time goes on, and carbon dioxide continues
to be dumped into the atmosphere, the amount of the warming commitment
will continue to increase.
At some unknown point -- another threshold
-- the amount of carbon dioxide in the atmosphere will be sufficient
to eventually induce the warming of continental slopes enough
to trigger enhanced methane venting, hydrate dissociation, and
sediment slumping. Then there will be a period of time -- more
lag time -- before massive dissociation and slumping actually
begin. During this time the atmosphere will be warming, and the
oceans will be warming, and the sediments on the seafloor will
be warming. Of course, that is exactly what is going on now, so
it is possible that we have actually crossed the carbon dioxide
threshold needed for these processes to occur, and that some considerable
seafloor methane release is now inevitable.
It is also possible that we have not
crossed that threshold, and may not for many more decades, or
even centuries. The time, however, is short. Commenting on the
determination that climate sensitivity (with a doubling of atmospheric
carbon dioxide) may range from 1.9°C to 11.5°C (Stainforth,
2005), Oxford University physicist Myles Allen indicated that
"uncertainty over global warming may mean that no such [safe]
threshold [for atmospheric carbon dioxide levels] may exist...
'The danger zone is not something in the future,' he says, 'We're
in it now'" (Hopkin, 2005).
Certainly, based on numerous projections
of global warming, the world will be considerably warmer by the
end of this century. Although various estimates of the size of
the temperature increase differ (the Stainforth study suggests
that a 3.4°C [6.1°F] increase is most likely with a doubling
of atmospheric carbon dioxide, and the best 2007 IPCC estimate
is 3.0°C [5.4°F]), virtually all estimates project an
increase. Moreover, it is important to remember that although
most estimates of carbon dioxide release and consequent global
warming project only until the end of the current century (or
to a doubling of atmospheric carbon dioxide from pre-industrial
levels, which most models assume will occur about that time),
there is no reason to believe that the anthropogenic warming of
the planet will cease at that point, and, indeed, every reason
to believe it will continue.
The existence of lag time, but of unknown
length, means that we will not suffer the consequences that can
ensue when there is immediate feedback. When someone puts a hand
on a hot stove, the message is received immediately. But when
negative consequences do not immediately follow, there is a tendency
to continue behaving the same way as in the past. It is likely,
therefore, that carbon dioxide emissions will continue until there
is clear, dramatic, and unambiguously negative feedback. That
is, until catastrophe. Of course, at that point we will have dumped
sufficient amounts of carbon dioxide into the atmosphere that
serious warming will continue for hundreds, thousands, or even
tens of thousands of years, into the future -- even if we were
to stop the dumping immediately.
"The added carbon dioxide declines
in a markedly non-exponential manner [that is, not in a smooth,
geometric curve]", state the authors of a section of the
1990 IPCC report (Shine, 1990). "There is an initial fast
decline over the first 10 years period, followed by a more gradual
decline over the next 100 years and a rather slow decline over
the thousand year time-scale. The time period for the first half-life
[during which half the added carbon dioxide will be gone] is typically
around 50 years, for the second [during which half of the remaining
added carbon dioxide will be gone], about 250 years" (Shine,
1990).
Calculations such as this have led many to believe that the carbon
dioxide we add to the atmosphere will be mostly gone in just a
few centuries, or in a thousand years at the most. Even the US
Environmental Protection Agency (EPA) states that the lifetime
of carbon dioxide is up to 200 years. According to geophysicist
David Archer, however, such projections are in error. His own
calculations indicate that "about 7% of carbon [in carbon
dioxide] released today will still be in the atmosphere in 100,000
years." He further states, "A better shorthand for public
discussion might be that CO¸2 sticks around for hundreds of years, plus 25%
that sticks around forever" (Archer, 2005). Not quite forever,
perhaps, but long enough that it could remain a problem far, far
into the future. The carbon dioxide we have already dumped into
the atmosphere, and that which we will dump, in other words, will
not easily go away. Neither will the warming it produces.
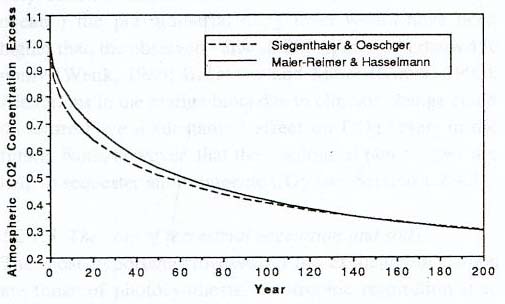 The decline of atmospheric
carbon dioxide over time, based
on a doubling of the amount of carbon dioxide from pre-industrial
times. After about 200 years, about 30% of the added carbon dioxide
is still around. Most of the added carbon dioxide winds up in
the ocean, and eventually the additional amount in the atmosphere
levels off to about 15%. [Even after 100,000 years, as much as
7% of the carbon dioxide now being dumped into the atmosphere
will still be around. Because residual carbon dioxide may stick
around for hundreds of thousands of years, and extend the above
curve to the right for several city blocks, it is referred to
as the "long tail" problem: see Archer, 2005.] But because
carbon dioxide will likely continue to be dumped into the atmosphere
well beyond the doubling point, this graph may only provide a
rough and possibly quite inaccurate glimpse of what is to come.
(Watson, 1990, based on data from Siegenthaler and Oeschger, 1987,
and Maier-Reimer and Hasselmann, 1987)
The decline of atmospheric
carbon dioxide over time, based
on a doubling of the amount of carbon dioxide from pre-industrial
times. After about 200 years, about 30% of the added carbon dioxide
is still around. Most of the added carbon dioxide winds up in
the ocean, and eventually the additional amount in the atmosphere
levels off to about 15%. [Even after 100,000 years, as much as
7% of the carbon dioxide now being dumped into the atmosphere
will still be around. Because residual carbon dioxide may stick
around for hundreds of thousands of years, and extend the above
curve to the right for several city blocks, it is referred to
as the "long tail" problem: see Archer, 2005.] But because
carbon dioxide will likely continue to be dumped into the atmosphere
well beyond the doubling point, this graph may only provide a
rough and possibly quite inaccurate glimpse of what is to come.
(Watson, 1990, based on data from Siegenthaler and Oeschger, 1987,
and Maier-Reimer and Hasselmann, 1987)
Undoubtedly the warming that the planet
has experienced in the twentieth century has already caused the
release of additional methane from permafrost and the continental
margins. There is no way that it could be otherwise: warming releases
methane. Furthermore, the rate of methane release will continue
to increase as we continue to warm the Earth. Just when this release
will shift from a more gradual to a more catastrophic mode (from
chronic to acute, to use the medical terms), is unpredictable.
This shift certainly depends on just how close to threshold conditions
continental margin methane is, which is something we have no way
of knowing. (Permafrost methane, although it potentially could
make a major contribution to global warming, is likely to only
be released gradually, though the rate of increase could change
rapidly.)
When? How long?
A methane catastrophe can be divided
in two parts, the initial or onset stage, together with that stage's
immediate consequences, and the longer-term consequences.
Onset
For a methane catastrophe to occur, methane must be released in
a short period of time. As mentioned previously (at the start
of the Methane Catastrophe section), scenarios which allow for
methane release over long periods (as many tens of thousands to
millions of years) cannot produce catastrophic consequences because
the excess methane released into the ocean would be consumed by
normal atmospheric and marine oxidation processes, and by expanded
populations of marine methanotrophs, other essential nutrients
being present. To produce catastrophic consequences, the duration
of the initial methane release must be a thousand years or possibly
a lot less, precisely to avoid these oxidation processes and the
possibility of a methanotroph population explosion.
It is important to note that once in
the atmosphere methane is oxidized in less than ten years, though
large quantities will temporarily overwhelm the oxidation system
and allow for more extended atmospheric lifetimes. Nonetheless,
even with a sudden and massive release the initial methane will
be around for only a limited period of time. Its successor, carbon
dioxide, will remain in the atmosphere considerably longer, but
even the level of carbon dioxide will decline as it is taken up
by photosynthetic organisms, the weathering of silicate rocks,
and the ocean.
There is a second consideration which
suggests that the onset stage of methane catastrophes cannot be
protracted in length. Microbes can reproduce at quite extraordinary
rates when nutrients are present and conditions favorable. Under
optimal conditions in the laboratory, for example, the gut bacterium
E. coli can double in number about every twenty minutes. Bacterial
methanotrophs presumably have similarly high reproductive rates.
While some methanotrophs are not bacteria, and are -- being archaea
-- extremely difficult to cultivate in laboratories, their potential
reproductive rates are also probably quite high. A gradual, extended
increase in ambient oceanic methane, therefore, would presumably
be easily consumed by the methanotrophs.
A methane catastrophe wreaks its havoc
via four primary killing mechanisms -- oceanic anoxia, acid rain,
and global warming. For these mechanisms to be maximally effective,
they must operate over a very limited period of time. (As mentioned
previously, rate is critical.) With the level of excess atmospheric
carbon dioxide and acid rain starting to decline just as soon
as they are produced (see Watson, 1990, diagram, above, for carbon
dioxide decline), and the global heat the carbon dioxide engenders
following closely -- though more slowly -- upon, the faster methane
delivers its wallop, the more powerful it is.
The work of numerous scientists has set
an upper limit on the possible length of the Paleocene-Eocene
methane release by their determinations of the duration of the
carbon isotope excursion. Dickens (1995) found it took less than
10,000 years; Bralower (1997), about 6000 years; Katz (1999),
less than 5000 years; Norris and Röhl (1999) "a few
thousand years or less." Kennett and Stott's 1991 finding
that Southern Ocean temperatures jumped about 8°C in only
2000 years probably further constrains the length of the Paleocene-Eocene
methane release. Considering that the faster it is, the stronger
the punch, therefore, an upper limit of a few centuries to possibly
a thousand years for the initial methane release is not unreasonable.
To the extent that seafloor methane was released (at least in
part) at the end of the Paleocene and the end of the Permian via
the intrusion of magmatic sills (which must be emplaced on a time
scale of decades: Svensen, 2004), the release time might have
been shorter still.
It should be emphasized that this is
simply the initial, catastrophe-producing release: the initial
jolt. As projected here, the altered climate and oceanic conditions
can last for millions of years, as they did after the initial
catastrophic methane release of the end-Permian. This is because
the initial jolt, with its anoxia, acid rain, and global heat,
so reorganizes the global climate and ocean system that dramatically
changed conditions can persist for great lengths of time before
and as recovery occurs. As modeled by Dickens (1997), for example,
the residual heat from a major methane release might last for
two million years or so, though the main warming would quickly
follow the release, and only minor warming would persist longer.
Triggers, Present and Past
The same "the faster it is, the stronger the punch"
logic that governed the Paleocene-Eocene warming applies as well
to the methane release triggering mechanism, increasing atmospheric
carbon dioxide. With our profligate burning of carbon fuels, however,
carbon dioxide seems to be entering the atmosphere at a rate vastly
faster than with any normal natural process.
We have already consumed almost half
of the world's supply of petroleum. The estimates of the total
amount of recoverable petroleum differ, and some petroleum experts
believe that it will be another decade or two before we reach
that halfway point. Nonetheless, within another fifty years, most
of the rest of the world's petroleum will be gone. That means
that we will no longer have to worry about carbon dioxide emissions
from petroleum-derived gasoline and other fuels. (Petroleum is
used for other purposes than fuel, such as for plastics, paraffin,
lubricants, and asphalt, but its primary use is to be burned for
energy.) All the carbon dioxide from those emissions will already
have been dumped into the atmosphere, although much will enter
the ocean thereafter. (Fortunately for those who cannot live without
the internal combustion engine, gasoline can be made from coal,
as it was by the Germans during World War II.)
Not only will most of the world's petroleum
be gone in some fifty years, in sixty to seventy years, most of
its ordinary natural gas (that is, excluding that hydrate methane
currently locked in permafrost or in continental margins) will
also be exhausted. Each of these carbon reservoirs (petroleum
and natural gas) is estimated to hold about 500 billion metric
tons (each roughly equivalent to an imperial, or American, ton)
of carbon (Kasting, 1998). Burned for their energy and injected
into the atmosphere as carbon dioxide, that's more than enough
carbon than is needed to double the atmosphere's current carbon
reservoir (now approaching 800 billion metric tons).
The Earth's reserves of coal, the most
plentiful of the fossil fuels, will last a bit longer: for 220
years, according to some estimates; for 300 or more, according
to others. Obviously, however, and within two centuries, most
of the planet's coal will also have found its way -- as carbon
dioxide -- into the atmosphere and oceans. And there's an estimated
4000 billion metric tons of carbon (Kasting, 1998) that awaits
its release via the burning of coal. That's more than five times
the amount currently in the atmosphere.
For most climate change modeling purposes,
future global warming is estimated on the basis of a doubling
of pre-industrial atmospheric carbon dioxide. Such a doubling
is projected to occur, at current rates of carbon dioxide emissions,
before the end of the current century. (Measurements from the
Mauna Loa Observatory now indicate the doubling period may be
closer to sixty than to one hundred years.) Possibly because of
the uncertainties associated with current projections of global
warming, few models examine what could happen as the dumping of
carbon dioxide continues beyond the point where atmospheric carbon
dioxide has doubled, but based on our current use patterns, such
dumping is almost certain to continue.
As paleoclimatologist (one who studies
ancient climates) James Kasting has noted (1998), we have the
ability not only to double the pre-industrial level of atmospheric
carbon dioxide once, but to double it again, and double it yet
again. (And, it should be added, we could actually come close
to doubling it a fourth time!) And all in a period of perhaps
just over two centuries, or three at most. In short, in addition
to the carbon dioxide we have already dumped into the atmosphere,
we have the ability to dump lots more, and probably will. Enough
to thoroughly and rapidly warm the planet, and trigger a methane
catastrophe.
The past 500 million years have recorded
only a small number of methane catastrophes. Those of the end-Permian,
the end-Triassic, the Jurassic (Toarcian and Oxfordian), the Paleocene-Eocene,
and perhaps a few of lesser importance in the early Cretaceous
may comprise the entire list. Probably only these satisfy the
prerequisite of a rapid and significant warming trigger.
For the greatest of these events -- those
of the end-Permian, the end-Triassic, the Paleocene-Eocene, and
the Toarcian -- the warming trigger was presumably twofold. The
most important trigger for each of these events was probably the
direct intrusion of seafloor sediments by volcanic magma during
the eruptions which created large igneous provinces: the Siberian
Traps, the Central Atlantic Magmatic Province (CAMP), the North
Atlantic Igneous Province (NAIP), and the Karroo Igneous Province,
respectively (Vermeij and Dorritie, 1996; Dorritie, 2002; Svensen,
2004). In addition to directly heating the hydrate-bearing sediments,
the magma also warmed the marine sediments and, thereby, the ocean.
Where the ocean basin was small and restricted in its circulation,
as with CAMP, the NAIP, and the Karroo Igneous Province, oceanic
warming would have been more effective than if the massive volcanism
took place in a less enclosed setting. But colder regions (as
with the Siberian Traps) would have been more seriously impacted
than warmer ones, other things being equal.
Each of these eruptive sequences probably
had a large underwater component, although some may have had a
major subaerial (under the air, that is, terrestrial) component
as well. But all of these eruptive sequences injected large quantities
of carbon dioxide into the atmosphere (the Central Atlantic Magmatic
Province and the Siberian Traps most), the submarine eruptions
acidifying the ocean locally as the carbon dioxide rose through
the water column. This injection of carbon dioxide into the atmosphere
caused a general warming of the surface of the planet, much as
we are doing today. Except that our own (anthropogenic) carbon
dioxide release is probably proceeding considerably faster than
the volcanogenic carbon dioxide injections of the past. [My own
"back-of-the-envelope" calculations indicate that we
are currently injecting carbon dioxide into the atmosphere at
a rate that is somewhere between ten and hundreds of times faster
than the average rate of volcanic degassing during the eruption
of the Central Atlantic Magmatic Province (CAMP degassing estimates
from Beerling and Berner, 2002). The anthropogenic injection rate,
moreover, is constantly increasing.]
Longer-term Consequences
It is certain that the methane that is
now being released from permafrost and the seafloor will contribute
to global warming, initially as methane, with a greenhouse capacity
that vastly exceeds that of carbon dioxide, and then, upon oxidation,
as carbon dioxide itself. With a greenhouse warming ability more
than 20 times carbon dioxide, methane that reaches the atmosphere
(and much that is released is likely to do so, because it will
exceed the current capacity of the marine methanotrophs to consume
it) has the potential of doing far more damage to the planet's
climate and biosphere than all the carbon dioxide that has been
and will likely be released into the atmosphere by the burning
of fossil fuels.
Simple arithmetic shows why. The total
amount of carbon locked up in fossil fuels is about 5000 billion
metric tons (each slightly more than an imperial ton). As mentioned,
in less than 100 years, almost all the carbon from petroleum and
natural gas will have been converted to carbon dioxide; by about
300 years from now, all the coal will be gone as well. So in about
300 years, much of 5000 billion metric tons of carbon will have
moved into the atmosphere as carbon dioxide, and about half may
then wind up in the ocean, where it will no longer help warm the
planet, but will continue to acidify the ocean. (There are other
natural "sinks" for carbon dioxide besides the ocean,
but research indicates that the absorptive capacity these sinks
may change greatly over time. Consequently, we should not be depending
on such natural sponges for soaking up the carbon dioxide we are
pumping into the atmosphere.) This carbon dioxide -- alone --
contains an amount of carbon equivalent to almost ten times the
amount of carbon that was in the atmosphere at the beginning of
the industrial age, and roughly seven times that of the present.
By contrast, there may be more than 10,000
billion metric tons of methane carbon that can be released from
the seafloor. Though this quantity is only twice that of the carbon
in fossil fuels, it possesses more than 40 times the short-term
warming potential of carbon dioxide. A 'mere' 250 billion metric
tons of methane carbon -- less than 1/40th (2.5%) of the estimated
total seafloor methane carbon reservoir -- has the warming capacity
of all fossil fuel carbon. Looked at another way, a release
of just 1% of seafloor methane (somewhat more than 100 billion
metric tons) has a warming potential several times greater than
the amount of anthropogenic carbon dioxide which scientists project
will enter the atmosphere in the next 60 to 100 years.
The geological record provides us with
only minimal guidance as to what might be expected from major
methane releases. Effects of the known methane catastrophes (at
least those which rise to the level of "catastrophe,"
which involves a several degree warming of atmosphere and ocean,
and probably at least transient ocean anoxia), vary considerably.
At the lower end of the range (represented by the oceanic anoxic
events of the Toarcian, 183 million years ago, and Aptian, between
116 and 112 million years ago), there was limited global warming
and transient deep ocean anoxia. More serious oceanic anoxia and
warming seems to have occurred at the end of the Paleocene (the
LPTM). Finally, in the most catastrophic event, at the end of
the Permian, there was a stunning global warming, a euxinic ocean
that lasted for millions of years, a significant drawdown of atmospheric
oxygen, and the most massive of all mass extinctions.
No doubt variables such as the geographic
location of particular methane-releasing submarine slumps, the
general state of the global climate at the time, and the configuration
of continents and oceans played a role in determining the severity
of these catastrophes, but probably the most significant factors
were the amount of and rate at which methane entered the atmosphere,
and the length of time it remained there. While we have no way
of estimating how much methane could enter the atmosphere as a
result of current anthropogenic global warming, as noted above,
even the release of a minute proportion of that which is available
could wreak havoc on our planet.
There are too many factors of unknown
size to allow any prediction of the long-term consequences of
a future methane catastrophe. The end-Permian will not serve as
a model, because the world was warmer then, even before the catastrophe.
Furthermore, during the past twenty million years or so, the globe
has cooled considerably. Many climatologists attribute this to
the movement of Antarctica to its current position directly over
the South Pole: if they are correct, the current cooler period
of Earth's history will continue until Antarctica moves off the
pole, an event at least tens of millions of years in the future.
The relatively greater warmth of the
Permian period may have been a contributing factor to the oceanic
anoxia of the Early Triassic. It is possible that in today's cooler
world, thermohaline circulation could be restored quickly, ventilating
the deep ocean, and allowing for rapid recovery. Even so, a "rapid"
recovery could take many millennia, perhaps tens or even hundreds
of millennia. If the jolt to the climate system is great enough,
however, and the ocean becomes largely anoxic, methane presumably
would continue to be produced by marine anaerobes until thermohaline
circulation, and therefore deep water oxidation, are restored.
When will the input of methane overwhelm
the global climate system?
Again, the unknown factors involved preclude
a simple answer. With present-day carbon dioxide, we know the
significant sources and have a fair sense of their coming likely
concentrations in the atmosphere. There is no reason to expect
that we will be surprised by a major release of carbon dioxide
from an unanticipated source. As destructive as carbon dioxide
is -- and will be -- for the Earth and its inhabitants, at least
we have a fairly good understanding of it, and can -- if we choose
-- have some control over it.
This is not the case with continental
margin methane. Although we have a rough estimate of its global
quantity, we have little idea of the details of its worldwide
distribution. We have no idea of how close continental margins
may be to the slumping threshold, which presumably varies from
place to place. We do not know how long it will take for the oceans
to warm as the atmosphere does. In fact, we are enormously surprised
that they have warmed as much as they have (Fukasawa, 2004). We
thought we knew how fast it would take for oceanic warming to
reach the region of the methane hydrates (Harvey and Huang, 1995);
we were wrong. Ocean warming will release continental margin methane
much faster than we previously thought (Pecher, 2002; Wood, 2002;
Zühlsdorff and Spieß, 2004).
The major factors involved in continental
margin methane release seem to be the following (assuming no major
near-term change in global thermohaline circulation):
1. How fast the oceans are heating up, particularly to the depth
of the deepest methane hydrates (about two kilometers, or 1.2
miles).
2. How fast that heat takes to penetrate the sediments to the
base of the gas hydrate stability zone (BGHSZ). (The BGHSZ, as
previously mentioned, is identical with the BSR, the bottom-simulating
reflector detected by sonar.)
3. How much methane will be released through the venting of free
gas and dissociating hydrate as the oceans warm.
4. How close continental margins are to their slumping thresholds.
While we cannot expect to know, except
in retrospect, how close continental margins are to their slumping
thresholds (item 4, above), or how rapidly free methane and dissociated
hydrate methane can be released into the ocean and atmosphere
(item 3, above), we may be able to obtain estimates for the first
two factors. The amount of time it would take for ocean warming
to penetrate the sediments to reach the hydrates (item 2, above)
has in fact been estimated. With the findings about the "roughness"
of the BSR, and the closeness of some hydrate and free gas to
the seafloor surface (about 15 meters; Wood, 2002), the sediment
penetration time may be as short as 55 years for a 6°C heat
pulse (Pecher, 2002). At the other extreme, it could take thousands
of years for a heat pulse to penetrate to the deepest hydrates.
The warming of the oceans may be a second
factor that can be estimated, though we do not yet possess enough
data to do so. We do know that down to a depth of 3000 meters
(about 2 miles), the oceans have warmed 0.06°C (about 0.1°F).
This is a minuscule amount of warming, but it has been determined
with great precision based on millions of measurements (Levitus,
2000), so it is reliable. We also know that the globe as a whole
warmed 0.6°C (1.1°F) plus or minus 0.2°C (about 0.4°F)
during the 20th century (Levitus, 2000). That's 0.06°C ocean
warming for 0.6°C global warming. Because the atmosphere warms
first (it has the greenhouse gas) during global warming, and then
it warms the ocean, ocean warming lags atmospheric warming. We
therefore can state with reasonable assurance that the oceans
will warm a minimum of about 0.1°C for every 1°C (that's
the same ratio as 0.06°C is to 0.6°C) that the globe warms,
at least in the near future.
If we then take the IPCC's maximum estimate
for global warming for the 21st century (remembering that it may
be a conservative estimate), that is, 5.8°C (10.4°F),
we can say that the maximum ocean warming in the 21st century
may be 0.58°C (1.04°F). "May be" should be stressed.
It could be less, just as the IPCC's 21st century warming estimate
ranges from 1.4°C (2.5°F) to 5.8°C (10.4°F). On
the other hand, it may well be more. Only when we have more data,
in another decade or so, will we be able to know the rate of oceanic
warming with some reasonable certainty.
This small amount of projected deep ocean
warming (about 0.6°C/1°F in the 21st century) is unlikely
to dissociate much hydrate. At such a slow rate of warming, it
would indeed be several centuries, if not much longer, before
even the free gas and hydrate closest to the sediment surface
began to be released. That is, if it took a significant heat pulse
(of say, 6°C, or 10.8°F) to release continental margin
methane. But it does not. At least some free gas below the hydrates,
remember, may be at threshold conditions, right now (Zühlsdorff
and Spieß, 2004). That means that any warming whatsoever
-- including the tiny amount of warming which has already occurred
-- may be enough to trigger the release of at least some methane.
Like the teapot on the stove in which the water is about to boil,
any increase in global heat can set the whistle blowing -- or
the methane flowing. How much methane will be released is something
we will discover, but in view of the huge amounts of methane available
in the continental margins, even a little may be sufficient to
dramatically alter climate.
Global warming and
methane release: A summary chart
Why the release may begin to arrive sooner than anticipated.
The release of methane
from seafloor hydrate via the warming of seafloor sediments involves
a number of processes. As atmospheric carbon dioxide increases,
the atmosphere and surface of the Earth warm. This warming also
warms the ocean. Eventually the ocean's increased warmth penetrates
the sediments to hydrate depth. Estimates have been made about
the duration of each of these processes. But more recent findings
or modeling suggest that the processes may be proceeding more
rapidly than the generally accepted views project:
| Process |
Generally accepted view |
Cause for concern |
Atmospheric
carbon dioxide increase |
About 100 years to a doubling of CO¸2
from pre-industrial levels (at the long-term rate of increase
of 1.8 ppmv per year). Pre-industrial CO¸2 was 280 ppmv;
the current level of CO¸2 is 380 ppmv. |
Recent measurements from the climate observatory
on Mauna Loa, Hawaii, indicate that the rate of increase may
have accelerated during the past five years (Lean, 2004). At
the current rate (2.2 ppmv), it will only be about 80 years to
a doubling of CO¸2. There is no reason to believe, however,
that
CO¸2 accumulation in the atmosphere will stop at the arbitrary
limit of only 560 ppmv, and every reason to believe that it will
not. |
Warming of atmosphere
("climate sensitivity": The usual way that climate
sensitivity is estimated is with a projected doubling of atmospheric
carbon dioxide. Climate scientists frequently use the formula
DT¸2X
to describe this sensitivity. The D
means a change in; the T is for global temperature; the 2X subscript refers to a doubling of carbon dioxide.
) |
IPCC says that with a CO¸2 doubling, global
temperatures at the end of the century will likely be in the
range of 1.4 to 5.8 °C (2.5 to 10.4°F)
According to Kerr, 2004 (Three degrees of warming), the general
consensus among climate scientists now is that a doubling of
atmospheric CO¸2 will most likely produce a 3.0°C/5.4°F
warming. |
Kerr, 2004, does note, however, that while climate
scientists generally agree on a lower bound of 1.5°C/2.7°F
for likely climate warming, and a most probable warming of 3.0°C/5.4°F,
there appears to be little agreement on the upper bound: "The
calculation of sensitivity probabilities goes highly nonlinear
at the high end, producing a small but statistically real chance
of an extreme warming." This uncertainty is greatly compounded
by the realization that it seems highly improbable that the anthropogenic
increase of atmospheric CO¸2 will cease with a mere doubling
of CO¸2.
In addition, climate modelers Andronova and Schlesinger (2001)
foresee a warming of between 1.0°C and 9.3°C (1.8°F
to 16.7°F) by the end of the century, and Alley has warned
that global temperatures could rise 10°C (18°F) in just
a short time, "tripping the switch" towards abrupt
climate change in only a few decades (Showstack, 2001) The climate
sensitivity projected by Andronova and Schlesinger has now received
supprort from the largest climate modeling simulation ever done,
the climateprediction.net experiment involving almost 100,000
home computers. With a doubling of atmospheric carbon dioxide,
this study indicates that global warming could be as much as
1.9°C (3.4°F) to 11.5°C (20.7°F; Stainforth,
2005).
Research on the Cretaceous Period, specifically from about 90
million years ago, may provide further evidence that increased
atmospheric carbon dioxide produces higher temperatures than
previously believed. Instead of the earlier estimates that the
warmest Cretaceous tropical ocean temperatures were around 9°C
higher than today's (at about 28°C), they may have been as
much as 14°C higher. Contemporaneous carbon dioxide levels
are estimated at between two and six times today's 380 ppm. Perhaps
more startling is the suggestion that one of the most-relied-upon
climate models (GENESIS, developed at Penn State University)
may be seriously underestimating climate sensitivity: in order
to obtain the proper match between Cretaceous tropical ocean
temperatures and atmospheric carbon dioxide levels, the assumed
level of atmospheric methane had to be increased to some thirty
times what it is today. Though these results require confirmation,
they may be pointing to major shortcomings in at least some climate
models (Bice, in press, cited in Kintisch, 2006).
An additional factor in the climate sensitivity models has now
also changed. Surprisingly, it has changed because of something
we are doing right: cleaning the air of pollutants. As we have
reduced the level of aerosols (particularly those of sulfate,
often found in coal, and thus released by coal-burning industries),
their presence in the atmosphere has been reduced. But aerosols
actually help cool the atmosphere, as we have known for some
time. The amount of cooling, however, was only estimated. Now,
as skies have become clearer, we have a better understanding
of just how much cooling the aerosols contributed. It is considerably
more than most computer climate models had assumed. When these
new, observation-based figures are plugged into the climate models,
they indicate "that future global warming may proceed at
or even above the upper extreme of the range projected by the
IPCC" (Andreae, 2005). According to the study's lead author,
"'If our model is right, things could become totally uncontrollable
in the second half of the century.'" Andreae's model, using
relatively conservative input values, indicates that global temperatures
could increase by 6° to 10°C (10.8° to 18°F)
by the century's end (Schiermeier, 2005). That is even higher
than the IPCC's highest estimate of 6.4°C (11.5°F: IPCC,
2007). |
| Warming of oceans |
Deeper ocean to take about 1000 years to begin
to warm |
Levitus, 2000, found that the North Atlantic's
temperature, averaged down to 3 km (about 2 miles), has increased
0.06°C, or about a tenth of a degree F, in 40 years. Similar
warming has occurred in all oceans. Fukasawa, 2004, found a tiny
but measurable temperature increase in deep waters (5 km/3 miles)
in the North Pacific over a period of 14 years. At such depths,
there should have been no warming at all.
Finally, a slowing of global thermohaline circulation (such as
contemplated by Broecker, 2001) could allow much faster warming
in the North Atlantic and perhaps elsewhere. |
| Warming of sediments to hydrate release depth |
Thousands of years, based on the former understanding
of the BSR
(Harvey and Huang, 1995, and Berner, 2002) Much faster, based
on the new understanding of the BSR (Wood, 2002). |
Pecher, 2002, suggests that heat from a warmed
ocean could penetrate the 15 meters of sediment to reach the
topmost methane hydrates in as little as 55 years. With much
methane hydrate already at critical pressure, methane could begin
to be released from sediment just as soon as it begins to warm
(Hornbach, 2004). Some of the free methane underlying the hydrate,
moreover, may be at threshold conditions, ready for release just
as soon as the sediment begins to warm (Zühlsdorff and Spieß,
2004). |
|
Sources, sinks, and
feedbacks.
Just as there are numerous
sources of the carbon dioxide in the atmosphere -- that produced
by the burning of fossil fuels being the major concern bceause
it is disturbing the previous natural balance -- there are also
what are referred to as carbon sinks. A sink is a way in which
carbon dioxide is removed from the atmosphere. The burial of
carbon debris in sediment at the bottom of the ocean, for example,
is an extremely important sink, partly because of the amount
of carbon which is removed from the carbon cycle, and partly
because this removal is for geologically significant periods
of time, and therefore is essentially permanent. Trees constitute
another sink because they incorporate carbon from carbon dioxide
in their trunks, branches, leaves, and roots, but this storage
is only temporary because trees eventually die and rot, releasing
that carbon. Over time, sinks may become saturated with carbon
dioxide, and begin to release it instead of storing it. This
change from sink to source is projected to occur with the terrestrial
biosphere over the course of the 21st century (Cox, 2000).
|
Most computer
modeling of climate change does not incorporate feedbacks from
the biosphere (the realm of living things), which can enhance
or reduce global warming. An example of of a biosphere feedback
which could enhance warming is faster metabolism by soil microbes,
which would force more carbon dioxide and methane into the atmosphere,
increasing greenhouse gas warming. Such a feedback, because it
adds to the initial effect, is referred to as a positive feedback.
On the other hand, at least some plants photosynthesize faster
in warmer conditions, thus drawing down atmospheric carbon dioxide,
at least as long as those plants are alive. This is an example
of a negative feedback, because the initial warming, in this
feedback, reduces greenhouse gas and thus helps cool the atmosphere.
The reason that most modeling fails to include biosphere feedbacks
is that the models are enormously complicated even without incorporating
such feedbacks, despite the recognition that they could have
important effects on projected outcomes. In addition, the actual
effects of many presumed biosphere feedbacks are only beginning
to be understood, and introducing them into models increases
uncertainty. |
Some of
the most important possible feedbacks are from increased photosynthesis
by land plants, and from the changes in the carbon dioxide uptake
of soils as a consequence of global warming. Although it was
once believed that increased warmth would result in a greater
uptake of carbon dioxide, it now appears that this uptake will
be much less than previously projected (Cox, 2000; Sarmiento,
2000). The oceans are also likely to absorb less carbon dioxide
than had been thought (Cox, 2000; Sarmiento, 2000). In other
words, the oceanic and terrestrial biosphere sinks are likely
to prove considerably less effective than had been assumed. This
means that as atmospheric carbon dioxide increases, more will
remain in the atmosphere. This extra carbon dioxide may result
in an additional 2.5°C (4.5°F) greater global
warming over land than projected by most climate change models
(Cox, 2000; Sarmiento, 2000). |
Worst Cases:
The foreseeable effects of a methane
catastrophe -- an anoxic deep ocean, an acidic ocean, stunning
global warming, desertification, increasingly acidified precipitation,
and stronger precipitation events -- will be sufficient to inflict
a colossal blow to the global environment, driving countless species
to extinction and rendering the conditions of human life immeasurably
more difficult. Unfortunately, there may be even worse consequences.
As global warming proceeds, thermohaline
circulation will slow and the world ocean will become increasingly
stratified. That is, the deeper ocean (below about 100 meters/yards),
with its nutrients, will become increasingly more isolated and
less interactive with the surface ocean, with its phytoplankton.
In oceanographers' terms, the ocean will become less mixed. This
will happen as a result of the warming of the polar regions, which
will see a much greater temperature increase than the rest of
the planet. (As Alaskans know, this is already happening.)
According to some newspaper reports and
scientific projections, the "Northwest Passage," an
ice-free marine route around northern North America from the Atlantic
to the Pacific, may be open in just a few decades. The Northwest
Passage achieved its fame in the sixteenth and again in the nineteenth
centuries, when it was vainly (and sometimes fatally) sought after
by several seafaring expeditions. The problem, we now fully recognize,
was that this route through Arctic waters was blocked by sea ice.
With global warming, however, Arctic sea ice will melt, and the
Arctic will become largely ice-free for much or eventually all
of the year.
The often gushingly enthusiastic projections
of a much shorter maritime route between Europe and the Far East,
however, ignore another consequence of the disappearance of the
sea ice. When seawater freezes, seawater salt is left behind:
the ice is entirely composed of fresh water. The remaining seawater
is consequently more saline, and more dense. With global warming,
as sea ice production slows or ceases, this "saltwater fractionation
engine" also slows or stops.
If no sea ice is produced, highly saline
water cannot be produced. This dense and frigid water, which today
carries oxygen to the ocean floor and drives global thermohaline
circulation, will cease to be. Its cessation will be the predominant
one of the many causes of the oceanic stratification and anoxia
that is to come.
As the deep ocean becomes increasingly
dysoxic and then anoxic, the aerobic organisms which currently
inhabit it will be replaced by anaerobic microbes, mostly sulfate-reducers.
And, as in today's Black Sea, they will pump out hydrogen sulfide
as a waste product. The deep ocean will become toxic as hydrogen
sulfide attacks all available iron (that dissolved in the ocean,
and that in living things) and sends it to the bottom as iron
pyrite.
Some hydrogen sulfide will undoubtedly
escape its confinement in the deep ocean and wreak havoc on neighboring
coasts at least locally (as it does along today's Namibian coast)
and perhaps regionally. But will it escape in sufficient quantities
that it will produce a globally toxic atmosphere, as has been
suggested for the end-Permian (Grice, 2005; Kump, 2005)? That
depends on the efficiency of green and other sulfur bacteria.
As previously noted, green sulfur bacteria
are anaerobic and anoxygenic (not using or producing oxygen) photosynthesizers
that live at the boundary between the oxic shallow waters of today's
Black Sea and its deeper anoxic waters. They consume most of the
hydrogen sulfide produced below. As anoxia encroaches on shallower
ocean depths, however, and allows the green sulfur bacteria (and
their cousins, the purple sulfur bacteria) to rise higher in the
water column, their activity presumably becomes more efficient:
there's more light available as an energy source. That means that
they (as well as their more distant cousins, the large sulfur
bacteria, which do not require sunlight) ought to be able to consume
more hydrogen sulfide. Other things being equal, therefore, the
efficiency of the sulfur bacterial "lid" (on the hydrogen
sulfide) ought to increase as anoxia reaches shallower depths.
But other things are not equal.
At increasingly shallow depths, regrettably,
ocean turbulence is greater, and the likelihood that this lid
will be disrupted is similarly greater. And global warming is
projected to increase the occurrence of extreme weather events,
which churn the ocean surface. The closer the probably imperfect
sulfur bacterial lid is to the surface, moreover, the shorter
the distance though which the hydrogen sulfide must pass to make
its escape into the atmosphere. In any case, the ultimate ability
of the sulfur bacterial lid to contain the hydrogen sulfide in
the deep is unknown. There is a distinct possibility, therefore,
that large quantities of hydrogen sulfide could indeed breach
containment, and deliver an additional, terrible blow to an already
reeling biosphere. Thus,
carbon
dioxide
catastrophe |
Æ
(could lead to) |
methane
catastrophe |
Æ
(could lead to) |
hydrogen
sulfide
catastrophe |
in the following fashion:
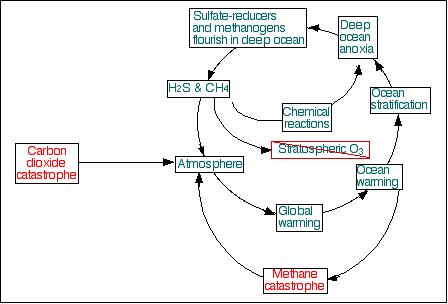
There is a second worst case scenario.
Deep ocean anoxia -- that is, anoxia extending as high as to within
100 meters (yards) of the ocean surface -- will also kill off
the giant larvaceans (remember them?) which live at depths from
100 to 500 meters. The demise of the giant larvaceans will mean
that the carbon rain they snag and deliver rapidly to seafloor
will take many times longer to make that trip, increasing its
chances of being decomposed along the way.
Were the demise of the giant larvaceans
the only consequence of the changed oceanic conditions in a warmer
world, it would eventually result in a serious depletion of atmospheric
oxygen, as less carbon would be removed from the global carbon
cycle. But in an anoxic ocean, decomposition will take place by
anaerobes instead of aerobes. This decomposition is much less
efficient, so much more carbon will make its way to the seafloor.
Over time, this additional carbon burial should increase the level
of atmospheric oxygen.
But there will also be unpredictable
changes in total carbon rain from near the ocean surface, where
most of it originates. On one hand, the carbon dioxide content
of the ocean surface will be increasing, potentially allowing
for an increase in phytoplankton activity, as well as an increase
in the zooplankton which consume it. On the other hand, phytoplankton
blooms are likely to be reduced by nutrient deprivation, brought
on by the limited water column mixing that will accompany a stratified
ocean. In addition, the coccolithophores, as noted previously,
are likely to be hard hit by increasing ocean acidity, which will
dissolve their skeletons. Coccoliths constitute a significant
portion of the phytoplankton. The less phytoplankton, the less
oxygen being released into the atmosphere. In addition, the less
phytoplankton, the less carbon rain, and the less carbon being
removed from the global carbon cycle.
The interaction of the disturbance of these various oxygen-carbon
cycle components is difficult, perhaps impossible, to predict.
Nonetheless, the potential for major, long-term changes to the
composition of the atmosphere is certain. On balance, it seems
more likely that oxygen levels may decline, especially with the
increased concentration of methane and possibly hydrogen sulfide
in the atmosphere. Creatures that require oxygen levels close
to the present 21% -- like us -- would be hard-pressed to survive,
because such a high level would not exist anywhere on the planet.
If oxygen levels do rise -- a scenario that carries its own health
risks, such as increased cancer -- people would be able to migrate
to higher elevations, at which oxygen levels would be less. But
there's less room up there as well, and a lot less agricultural
land. In neither case is the future stability of the oxygen level
assured: there could be great and even erratic departures from
any general trends as marine biology and chemistry shifts.
There is even a third worst case scenario.
Just as methane and hydrogen sulfide may have worked together
at the end of the Permian to destroy stratospheric ozone, the
same could happen in our future. Thus,
methane
catastrophe |
+
(plus) |
hydrogen
sulfide
catastrophe |
Æ
(could lead to) |
ozone
catastrophe |
With refrigeration gases having punched
two polar holes in the ozone layer, we already have a leg up on
this final scenario.
These worst case scenarios -- a hydrogen
sulfide catastrophe, unpredictable changes in the atmospheric
oxygen level, and the destruction of the ozone layer -- are not
mutually exclusive, it should be noted. The first two arise from
ocean warming and anoxia, and the third follows from the gases
that are released as a consequence. As oceanic stratification
and global warming proceed, all scenarios are possible, and, if
anoxia takes does hold of the deep ocean, all may be inevitable.
A DEPLETED EXISTENCE
During a methane catastrophe (there seems no point in trying to
describe an aftermath that lies thousands of years in the future),
human beings will face a depleted existence. Global warming is
currently projected to kill off, or "commit to extinction,"
between 15 and 37% of presently-existing species in just 50 years
(Thomas, 2004); far more will be driven to extinction by the end
of the century, and in the centuries following. Global warming
(and its accompanying effects of acid rain, an acidic and largely
anoxic ocean, and so on) will not be the only cause of the extinction
of species: increasing encroachment by the rapidly growing human
population on the habitats of other organisms, the unceasing exploitation
of limited organic resources (as trees, fish) and the conversion
of the planet solely to suit our own needs will also take their
substantial toll. In addition to the extinction of other species,
we will also face the destruction of our own global economy.
There are at least three outstanding
examples of what happens when people ignore the limitations imposed
by climate, or when they simply become the victims of natural
climate change.
The Maya
At one time, the Mayan regions of Central America (predominantly
in Guatemala and Mexico's Yucatan) hosted a population of from
three to thirteen million. This was at the height of the Classical
Maya, about 750 CE. The Maya, who had begun to construct cities
about 150 CE, apparently suffered one setback about 250 CE, when
they abandoned these cities, perhaps as a consequence of drought.
But thereafter the Maya flourished, until the beginning of the
ninth century. Within about one hundred and fifty years, first
in more southern and central regions and later in the north, Mayan
civilization fell into sharp decline, and its cities were abandoned
(Haug, 2003).
The probable cause was a series of droughts,
the first short episode occurring about 760 CE. Then, as the area
became generally somewhat drier, three catastrophic multi-year
episodes of drought seem to have happened, centered about 810,
860, and 910 CE. Interestingly, this timing seems to coincide
with periods of intense cold in Scandinavia, possibly indicating
a global rather than regional change in climate. The timing of
the droughts also seems to coincide with a three-stage pattern
of the abandonment of Mayan cities, though this suggestion apparently
is controversial. Nonetheless, the episodes of drought likely
gave rise to the cultural upheavals that characterized the Terminal
Classical Period, and the final Mayan collapse (Hodell, 1995;
Gill, 2000; and Hodell, 2001, as confirmed by Haug, 2003).
At its peak, Mayan civilization was presumably
able to address the economic needs of its population. But that
population, because of the very success of its economic and political
system, probably had reached the limit of the ability of the Central
American region's to provide for Mayan needs, particularly for
food. The food supply depended on the availability of water, and
an assortment of cenotes (natural pools in limestone), reservoirs,
and water conservation strategies were employed to supplement
the highly seasonal rainfall. When climatic conditions began to
decline, however, the region's ability to support the Mayan population
also fell, and during the times of multi-year drought, Mayans
would have starved.
The Mayans had reached the carrying capacity
of their environment; then, when conditions became decidedly less
favorable, that carrying capacity plummeted, and with it went
Mayan civilization. The term 'carrying capacity' is customarily
applied to rangeland in the case of livestock, and a given ecological
area in the case of wild animals. But its application seems quite
appropriate here (it is used by Haug, 2003) in dealing with the
consequences of adverse climate change on human cultures. Numerous
other civilizations -- among them that of the Moche in Peru, the
Anasazi in the US Southwest, that of Ubar in Oman, and many others
at the edges of desert regions in Africa and Asia -- may have
suffered similar fates. Significant heat or cold, or drought,
can abruptly lower the carrying capacity of areas inhabited and
developed by human beings, with consequences similar to those
that happen to other creatures.
Iceland
The history of Iceland provides another glimpse of what a depleted
existence could be like. Iceland was settled by the Viking farmers
in about 870 CE, and within fifty years, most of the island's
birch trees had been chopped down, for fuel, building, and clearing
land for farming. The farmers had brought cattle, sheep, horses,
goats, and pigs with them, but the goats tore apart the forests
and the pigs ripped up the land in their search for food. Within
about two hundred years, possibly because they had depleted their
own food sources, the goats and pigs had all but disappeared,
but the damage they had done remained. The island's trees were
almost gone, and the soil, which requires centuries to replenish
in the colder parts of the world, was rapidly being eroded away
(Ogilvie and McGovern, 2000).
In the meantime, the global climate had
turned colder, and the warm conditions that had allowed the Vikings
to settle even in Greenland were ending. The Greenland settlements
were abandoned, or their inhabitants simply starved, and Icelanders
were pushed to the brink. Despite a lack of wood for fishing vessels,
many Icelanders were forced to fish to supplement the meager production
of their farms, which had been devastated by the loss of farm
animals during increasingly harsh winters. Both people and natural
climate change were therefore responsible for the serious economic
hardship and even starvation that occurred in the fourteenth through
the sixteenth centuries (Ogilvie and McGovern, 2000). Those with
extensive land and livestock holdings were in a better position
to survive: "It is not surprising that these rulers probably
chose to ignore the early signs of climate change despite its
long-term threats to Icelandic society as a whole: then as now,
politics and ecology seem to have been closely interconnected"
(Ogilvie and McGovern, 2000, p. 390).
Easter Island (Rapa Nui)
Another island may provide an even better indication of what happens
when people ignore the constraints their environment imposes.
Unlike Iceland, which is a large island located about a thousand
kilometers (600 miles or so) from Scandinavia, Easter Island (Rapa
Nui) is a tiny patch of land (about 160 square kilometers; 64
square miles) isolated by more than 3000 kilometers of South Pacific
ocean from South America, the nearest continent. No ocean-going
vessels intentionally made their way to Rapa Nui during most of
its existence as an inhabited island (in contrast to Iceland,
which was frequented by ships from Scandinavia), and indeed, for
hunderds of years, the world never knew or even suspected that
Rapa Nui existed. It has been described as "the world's most
isolated scrap of habitable land" (Diamond, 1995).
Settled around 1200 CE (Hunt and Lipo,
2006; other scientists place the settlement date at the fifth
century CE [Diamond, 1995] or about 900 CE [David Steadman, as
cited in Bower, 2006]) by Polynesian seafarers, Rapa Nui, like
Iceland, had a fertile volcanic soil. Like Iceland, it possessed
a forest, composed, because of its position near the Tropic of
Capricorn (23 1/2°S), of subtropical trees, bushes, and shrubs.
Its isolation made it a haven and nesting site for numerous species
of seabirds, as well as birds like owls, parrots and herons that
made Rapa Nui home. Shellfish, fish, and dolphins were abundant
locally. The Polynesians themselves also brought chickens (in
addition, inadvertently, to rats), and grew sweet potatoes, bananas,
sugarcane and the edible taro root (Diamond, 1995).
Once the inhabitants of Rapa Nui reached
a level of economic stability and success, they were able to devote
part of their attention to the construction of the massive stone
figures for which the island is famous. Hundreds of these huge,
multi-ton statues were erected after being carved out of the rock
and hauled long distances (about 10 kilometers, or 6 miles); many
hundreds more were abandoned at various stages of completion.
The period of figure carving and statue erection seems to have
occurred between about 1200 to 1500 CE, just as the island's population
was peaking at about 7,000 to possibly as many as 20,000 (Diamond,
1995).
 Some of the great stone statues
at Easter Island. These statues
(called moai) were constructed and erected many hundreds of years
ago, and thrown down in civil disturbances in the following centuries.
They have been raised again in the 20th century. As they had in
the past, the statues face the empty sea. Were they placed there
to warn off possibly hostile visitors, or, as an earlier version
of a Search for Extraterrestrial (here, off-island) Intelligence,
in the forlorn hope that passing seafarers would contact the islanders?
Some of the great stone statues
at Easter Island. These statues
(called moai) were constructed and erected many hundreds of years
ago, and thrown down in civil disturbances in the following centuries.
They have been raised again in the 20th century. As they had in
the past, the statues face the empty sea. Were they placed there
to warn off possibly hostile visitors, or, as an earlier version
of a Search for Extraterrestrial (here, off-island) Intelligence,
in the forlorn hope that passing seafarers would contact the islanders?
But the inhabitants were wreaking environmental
destruction on their home. The trees that had been used for construction,
fuel, canoes, and even rope were disappearing within several centuries
of the Polynesians' arrival. By about 1400, the Easter Island
palm, its largest tree and the source of its canoes, was extinct.
Dolphins could no longer be hunted: they were too far out at sea.
By the end of the fifteenth century, the forest was entirely gone.
With the destruction of the native vegetation, the soil was eroded
and crop yields declined. Every single species of resident bird
was wiped out, and more than half the seabird nesting sites with
them. The size of the population fell and social order succumbed
to lawlessness and thuggery. Even cannibalism ensued. By about
1700, the population was declining to a mere fraction (1/4th to
1/10th) of what it had been at its peak. When the first Europeans
arrived, on Easter of 1722 (giving the island its European name;
Rapa Nui is the Polynesian name), they found an impoverished population
eking out a subsistence living on a treeless desert island (Diamond,
1995).
As Jared Diamond (1995) has put it, "Easter
Island is Earth writ small." Our own usually unobtrusive
pace of environmental destruction and climate alteration makes
people unaware of -- or, when aware, all too often indifferent
to, or even contemptuous of -- the potential damage of their activities.
But unlike the Easter Islanders, who would not "have noticed
the felling of the last small palm" (Diamond, 1995), scientists
have repeatedly warned that catastrophe awaits us unless we act
now to curtail the reckless exploitation of our planet.
[Note: Since this section was written in 2004, Jared Diamond's
book, Collapse: How Societies Choose to Fail or Succeed,
has been published. The book has received excellent reviews in
both Science and Nature. Though I have not yet had
time to read it myself, I have enough familiarity with Diamond's
work that I feel comfortable in highly recommending his book to
the reader.]
The crust of the Earth has been compared
to the skin on the top of a pudding, and ourselves to microbes
that live on the skin's surface. Just as the microbes go about
their business undisturbed by the nature of the skin and the pudding,
so we also live on the Earth, taking it for granted, and largely
unaware of its existence.
Below us, and around us, the Earth is
in ceaseless motion. For the most part this motion occurs with
extraordinary slowness, as the great plates of continents and
oceans move about the planet's surface and jostle each other at
the rate that fingernails grow. Only when earthquakes smash our
buildings and other constructs, or volcanoes cover cities with
ash (as Mount St. Helens did with Yakima, Washington, in its 1980
eruption), or floods drown cities, towns and farms (California,
North Dakota, Danubian Europe, Germany) as in the late 20th century
and early 21st, do we pay attention, at least for a bit. But these
events typically do not affect us; usually they happen to others
far away, intruding into our consciousness only by way of the
morning newspaper or the evening television news.
Beneath our feet, however, and around
us and overhead, the Earth goes about its own business, in as
much ignorance and disregard for us as we have for it. But if
we continue to abuse it, and in particular, if we continue to
use the atmosphere as a sewer (as Stephen Schneider has put it),
the Earth will suddenly and appallingly rise up against us, and
we will pay a terrible, deadly price.
CONTINUE
TO NEXT SECTION (PART II, Continued: Can science save us?)
RETURN
TO CONTENTS